Figures & data
Figure 1. Characterization of the cellular composition of undifferentiated basolateral-out porcine enteroids and apical-out enteroids. (A) Bright field photographs of porcine enteroids after different times of development (4–13 days). (B) Bright field photographs of Matrigel-embedded basolateral-out enteroids (left) and suspended apical-out enteroids (right); Scale bars: 100 µm. The symbols ★, ● and ▾ indicate enteroids which were considered as apical-out enteroids, enteroids with mixed polarity and basolateral-out enteroids, respectively. (C) At day 0 and 3, basolateral-out enteroids, apical-out enteroids and enteroids with mixed polarity in suspension culture were quantified. (D) Basolateral-out enteroids and apical-out enteroids were analyzed by immunofluorescence microscopy for apical tight junction protein (ZO-1, green) and for the presence of proliferative cells (KI-67, red), enterocytes (Villin, red), enteroendocrine cells (CHGA, green), goblet cells (MUC2, red), and Paneth cells (LYS, red). Nuclei were stained with DAPI (blue). Scale bars: 50 µm.
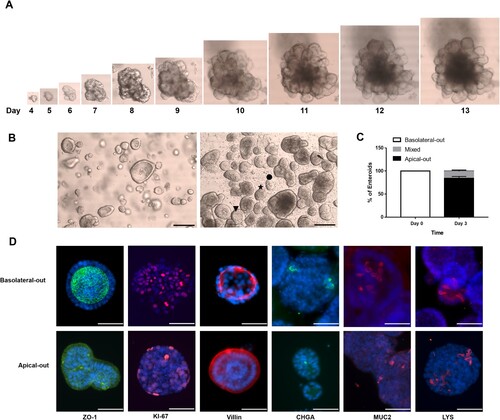
Table 1. Antibodies used for immunofluorescence analysis.
Table 2. Primers and probes used for RT-qPCR.
Figure 2. Apical-out enteroids are susceptible to infection by porcine rotavirus (RV). Basolateral-out and apical-out enteroids were infected with porcine RV. (A) At 24 h post infection (h.p.i.) and 48 h.p.i., infected enteroids and mock enteroids were subjected to immunostaining of rotavirus antigen (red); tight junctions were stained by ZO-1 specific antibody (green), and the nuclei were stained with DAPI (blue). RV positive cells have been pointed by white arrows. (B) The course of infection was analyzed by RT-qPCR to determine the number of viral RNA copies (encoding RV non-structural protein 3, NSP3) produced per well at the indicated time points post infection in basolateral-out and apical-out enteroids. The experiments were conducted three independent times. (C) Assessment of enterocyte infection. RV antigen-containing cells (left, red), Villin-containing cells (middle, green), and merged images (right) are shown. (D) Assessment of goblet cells infection. RV antigen-containing cells (left, red), MUC2-containing cells (middle, green), and merged images (right) are shown. (E) Assessment of Paneth cells infection. RV antigen-containing cells (left, red), Lysozyme-containing cells (middle, green), and merged images (right) are shown. (F) Apoptosis induced by rotavirus was visualized by immunostaining of RV antigen (left, red) and cleaved caspase-3 (middle, green); merged images are shown on the right. (C–F) Mock infected (upper panel) and RV infected (lower panel) organoids are shown. Merged images: nuclei were stained by DAPI (blue); scale bars: 50 µm.
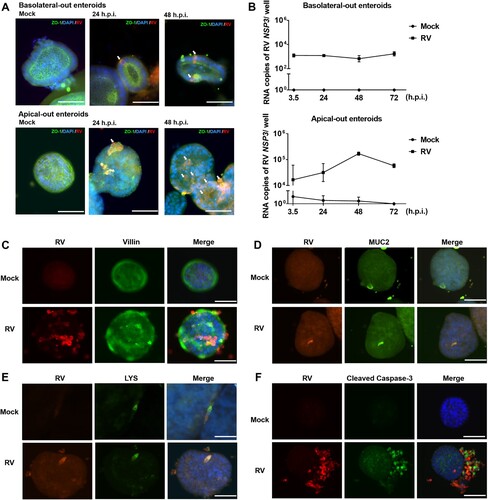
Figure 3. Characterization of the cellular composition of 2D monolayers of differentiated porcine intestinal epithelial cells. (A) The barrier function of the polarized epithelial cells was assessed by measuring the transepithelial electric resistance (TEER) at the indicated time points post differentiation. The TEER measurement was conducted three independent times. (B) Tight junctions were stained with an antibody directed against ZO-1. Scale bar: 10 µm. Inserted small image: nuclei were stained by DAPI (blue). (C) H&E staining (upper panel) and immunohistochemistry analysis with an antibody against Villin (lower panel) of a vertical section of 2D polarized porcine intestinal epithelial cells after four days of culture in monolayer medium followed by four days in differentiation medium. Scale bars: 20 µm. (D) The transcriptional levels of cell markers in differentiated intestinal epithelial cells were determined via RT-qPCR at the indicated time points. The transcription level at 2 days post differentiation was set to 1 and relative transcription levels are shown. LGR5 represents stem cells, SGLT1 represents enterocytes, CHGA represents enteroendocrine cells and MUC2 represents goblet cells. All data were calculated using the 2−ΔΔCT method. The experiments were conducted two independent times. (E) Assessment of 2D monolayers for the presence of cells that are characteristic for the intestinal epithelium (from left to right): enterocytes (staining of Villin, red), enteroendocrine cells (staining of CHGA, green), goblet cells (staining of MUC2, red) and Paneth cells (staining of LYS, green). Nuclei were stained by DAPI (blue). Scale bars: 100 µm.
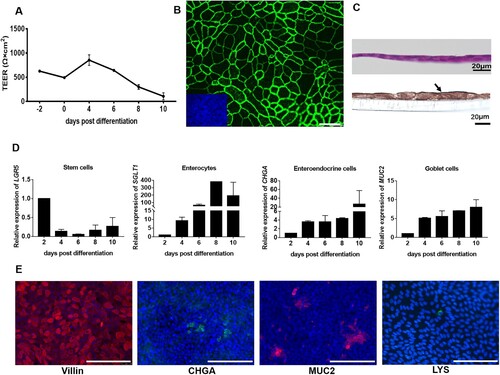
Figure 4. Porcine rotavirus (RV) infection of 2D monolayers of differentiated intestinal epithelial cells. 2D intestinal epithelial cells were infected with porcine RV from either the apical or the basolateral surface. (A) At 24 h.p.i., mock monolayers and infected monolayers were subjected to immunostaining of rotavirus antigen (red) and staining of nuclei by DAPI (blue). Scale bars: 100 µm. (B) The courses of apical and basolateral RV infections were analyzed by RT-qPCR to determine the amount of viral RNA accumulated at the indicated time points. The experiments were conducted three independent times. (C) Infection of enterocytes was assessed by visualizing rotavirus antigen-containing cells (left, red) and Villin-containing cells (middle, green); a merged image is shown on the right. (D) Infection of goblet cells was assessed by visualizing rotavirus antigen-containing cells (left, red) and MUC2-containing cells (middle, green); a merged image is shown on the right. (E) Infection of Paneth cells was assessed by visualizing rotavirus antigen-containing cells (left, red) and Lysozyme-containing cells (middle, green); a merged image is shown on the right. (C–E) Nuclei were stained by DAPI (blue). Scale bars: 100 µm.
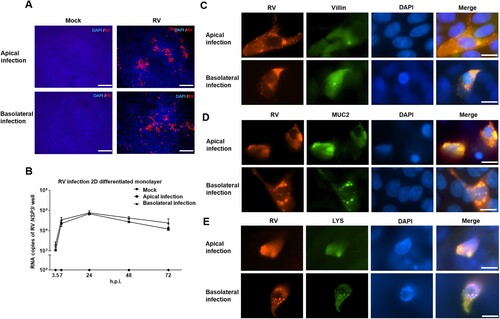
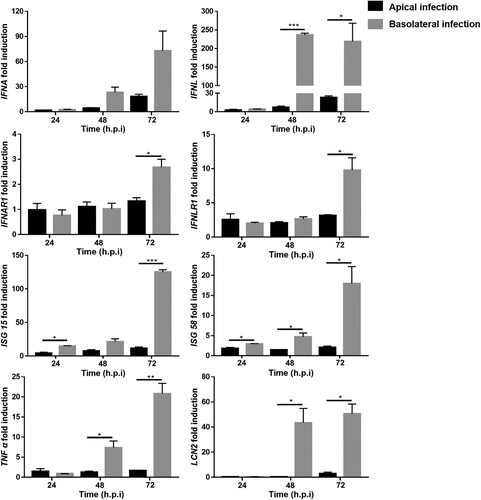
Figure 5. Porcine intestinal epithelial cells respond to rotavirus (RV) infection. 2D monolayers of differentiated porcine intestinal epithelial cells were infected with porcine RV at MOI = 1 from either the apical surface or the basolateral surface. Samples were collected at 24, 48, and 72 h.p.i.. The relative transcriptional expression of IFNA, IFNL, IFNAR1, IFNLR1, ISG 15, ISG 58, TNF α, and LCN2 was evaluated by RT-qPCR. The experiments were conducted three independent times. All data were calculated using the 2−ΔΔCT method. Results are shown as the mean +/− s.d. and are expressed as fold induction of expression related to transcription levels of mock infected cells which were set to 1. For comparison of response after apical and basolateral infections, P values were determined using unpaired Student’s t-test (and nonparametric tests) in GraphPad Prism. Comparative indicator labels are only shown when p < 0.05. *p < 0.05, **p < 0.01, ***p < 0.001. In the IFNA panel, comparative indicator labels are not shown because P values at 48 and 72 h.p.i. are above 0.05 (at 48 h, p = 0.0516; at 72 h, p = 0.0817).