
Figures & data
Figure 1. SARS-CoV-2 clades in M-V in the time period from November 2020 till March 2022. Map of M-V with the individual SARS-CoV-2 clades distribution and the total number of sequences per county. VR Vorpommern-Rügen, VG Vorpommern-Greifswald, R Rostock, LR – Landkreis Rostock, MS – Mecklenburgische Seenplatte, NWM Nordwestmecklenburg, S Schwerin, PL Parchim-Ludwigslust
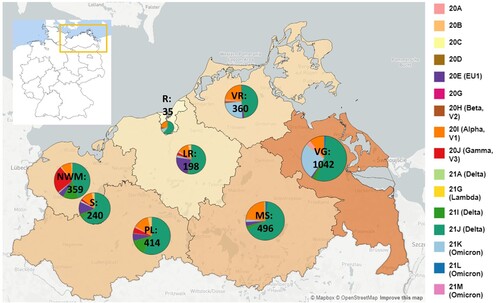
Figure 2. Time-resolved maximum likelihood phylogeny of 3493 in M-V sampled sequences and their comparison of SARS-CoV-2 clades circulating in Europe and worldwide during the same period. A. SARS-CoV-2 sequences were aligned by MAFFT v7.490 and the resulting multiple sequence alignment (MSA) was used to generate a corresponding phylogenetic tree using RAxML v.8.2.12. We used the WUHAN MN908947.3 as the outgroup reference sequence. To generate and visualize the corresponding time tree we utilized Nextstrain tools Augur and Auspice. The legend on the left shows the colours of the Nextstrain nomenclature clades shown in the phylogentic tree. The asterisk marks the start point of this study. B. Comparison of SARS-CoV-2 clades circulating in M-V with those found in Europe and worldwide over the same period from November 2020 to February 2022. In total, 1177 European and 1687 worldwide randomly picked sequences were downloaded from GISAID (Table S2) and compared with 3493 in M-V sampled sequences.
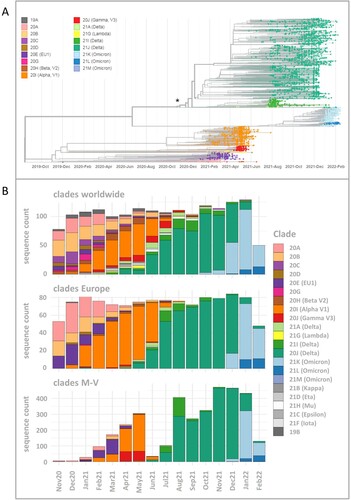
Figure 3. Spatio-temporal distribution of SARS-CoV-2 clades in Mecklenburg-Western Pomerania analyzed by genetic analysis of sequences generated within the framework of CoMV-Gen. A: Numbers of sequences coloured by clades level week-by-week and B geographical distribution of clades in M-V month-by-month.
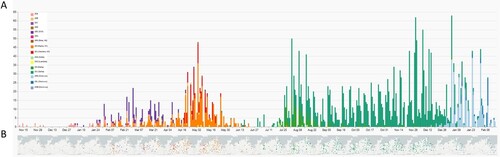
Figure 4. Relative distribution of SARS-CoV-2 lineages isolated in Mecklenburg-Vorpommern from November 2020 to February 2022 based on whole-genome sequencing. A. Shown is the relative lineage distribution [%] over 3493 sequences obtained in M-V. The PANGOLIN lineage system (https://cov-lineages.org/) for variants was used. The colours represent the different SARS-CoV-2 lineages. For easier orientation, SARS-CoV-2 lineages with higher proportions were marked in the diagram with white font. In addition, individual SARS-CoV-2 lineages are also listed in the legend according to their chronological course (from top left to bottom right). B. Presentation of the absolute number of SARS-CoV-2 lineages identified per month.
![Figure 4. Relative distribution of SARS-CoV-2 lineages isolated in Mecklenburg-Vorpommern from November 2020 to February 2022 based on whole-genome sequencing. A. Shown is the relative lineage distribution [%] over 3493 sequences obtained in M-V. The PANGOLIN lineage system (https://cov-lineages.org/) for variants was used. The colours represent the different SARS-CoV-2 lineages. For easier orientation, SARS-CoV-2 lineages with higher proportions were marked in the diagram with white font. In addition, individual SARS-CoV-2 lineages are also listed in the legend according to their chronological course (from top left to bottom right). B. Presentation of the absolute number of SARS-CoV-2 lineages identified per month.](/cms/asset/d3f60ee7-9435-42fe-a1f5-91e0c8224b44/temi_a_2245916_f0004_oc.jpg)
Figure 5. Time-resolved k-mean/median-clustering (KMC) of SARS-CoV-2 lineages identified from November 2020 to March 2022 in M-V. 3493 sequences were assigned to 116 different PANGOLIN lineages and combined with the date of infection. Afterwards a KMC was used to find lineages with a similar time course of occurrence. Shown are the distributions of every lineage in [%] over all sequences. The KMC was performed by the MultipleExperiment Viewer 4.9.0 (TMEV 4.9.0) with following parameters: KMC mode: calculated means, cluster: 10, Iterations: 50, HCL: no linkage, Pearson correlation.
![Figure 5. Time-resolved k-mean/median-clustering (KMC) of SARS-CoV-2 lineages identified from November 2020 to March 2022 in M-V. 3493 sequences were assigned to 116 different PANGOLIN lineages and combined with the date of infection. Afterwards a KMC was used to find lineages with a similar time course of occurrence. Shown are the distributions of every lineage in [%] over all sequences. The KMC was performed by the MultipleExperiment Viewer 4.9.0 (TMEV 4.9.0) with following parameters: KMC mode: calculated means, cluster: 10, Iterations: 50, HCL: no linkage, Pearson correlation.](/cms/asset/1e63e28d-3ede-4dfd-891d-866d6d607ab9/temi_a_2245916_f0005_oc.jpg)
Figure 6. Spatially-resolved maximum likelihood phylogeny of M-V sampled sequences. SARS-CoV-2 sequences were aligned by MAFFT v7.490 and the resulting MSA was used to generate a corresponding phylogenetic tree using RAxML v.8.2.12. We used the WUHAN MN908947.3 (19A) as the outgroup reference sequence. For the visualization we used the ggtree package. Tip nodes are coloured by clades. The inner circle shows the Nextstrain nomenclature clades and the outer circle describes the corresponding region of origin. Decrypted epidemic connections are marked with pictograms.
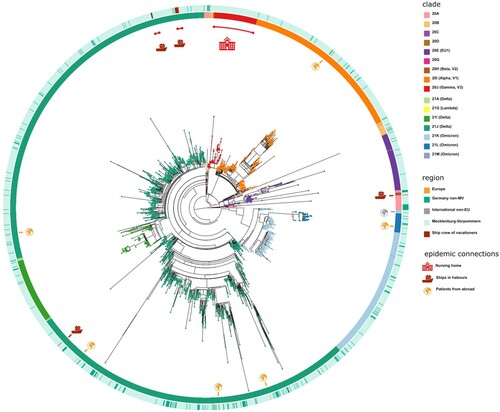
Figure 7. Distribution of SARS-CoV-2 clades and lineages of non-M-V and M-V residents and the proportion of the SARS-CoV-2 lineages over all clades and/or WHO label. A. Distribution of SARS-CoV-2 clades and lineages of non-M-V and M-V residents. The clades were determined by Nextstrain (https://nextstrain.org/sars-cov-2) and the lineages were taken from Pangolin (https://cov-lineages.org/resources/pangolin.html). The distributions are shown in VENN diagrams including all single clades (left side) or all single lineages (right side). B. Shown is the relative distribution of SARS-CoV-2 lineages per clade over all samples drawn in M-V (total, n = 3493), main residents of M-V (M-V, n = 3144) and non-M-V residents (non-M-V, n = 349). X-axis shows the Nextstrain clades and /or WHO label (Alpha, Beta, Gamma, Delta, Lambda, Omicron). For clarity, Nextstrain clades belonging to one WHO label (Delta and Omicron) have been grouped together.
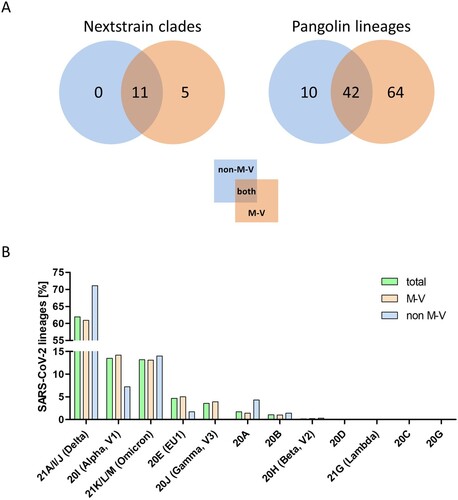
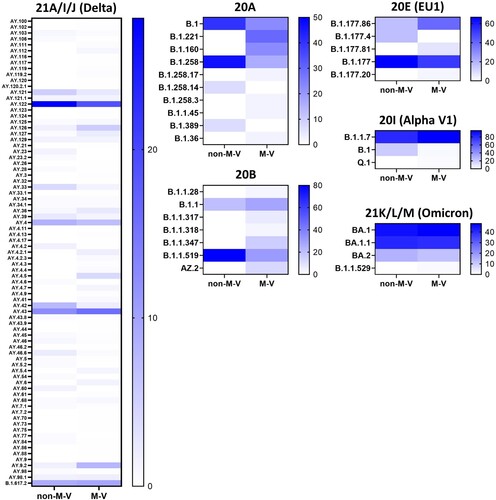
Figure 8. Heatmap showing the proportion of the SARS-CoV-2 lineages within a clade and/or WHO label (Alpha, Delta, Omicron). Percentages were calculated from the number of sequences per lineage and clade/WHO label relative to the total number of all samples of each clade and/or WHO label within the respective group. Not shown are the data of the clades 20C, 20D, 20G, 20H (Beta), 20J (Gamma) and 21G (Lambda) because of their low numbers of samples per lineages and clade or the sequences were only found in one group (e.g. 20J (Gamma)). The strength of the blue colour corresponds to the percentage of the SARS-CoV-2 line per clade and/or WHO label and can be evaluated in the respective legend. non-M-V: non-M-V residents, M-V: M-V residents
Supplemental Material
Download PDF (474 KB)Supplemental Material
Download PDF (555.7 KB)Supplemental Material
Download PDF (141.7 KB)Supplemental Material
Download MS Excel (128.3 KB)Supplemental Material
Download MS Excel (268.1 KB)Supplemental Material
Download MS Word (23.6 KB)Data availability statement
All sequence data generated for this study were deposited in the European Nucleotide Archive (ENA) with accession number PRJEB59319.