
Figures & data
Figure 1. Effects of adjuvants on the H7N9 WV vaccine-induced antibody responses. BALB/c mice (n = 5 per group) were intramuscularly immunized twice with the H7N9 WV vaccine in combination with aluminum hydroxide (Alum) or CpG 1018. Serum samples were collected for humoral immune response evaluation at the indicated timepoint after the first immunization. (a, b) The levels of total IgG antibodies against H7N9 WV were assessed by ELISA. (c) H7N9-specific hemagglutination-inhibition (HI) antibodies were quantified by hemagglutination inhibition assay. The gray dashed line indicates a 10-fold initial dilution of serum samples. The black dashed line represents a ≥ 4-fold rise in HI titre, also called 4-fold seroconversion. (d) Vaccine-induced neutralizing activity against H7N9 was evaluated by microneutralization assay. The dashed line indicates a 20-fold initial dilution of serum samples. The log10-transformed IgG titre and log2-transformed HI and NT titres of sera collected at week 6 after the first immunization were analyzed by two-way ANOVA with Tukey’s posttest. * indicates comparisons of the adjuvant effect among the same antigen dose groups. # indicates comparisons between the various antigen doses that were adjuvanted with Alum/CpG 1018. @ indicates comparisons between the 1.5 μg HA with Alum and 0.15 μg HA with Alum/CpG 1018 groups. */#P < 0.05, **/##/@@P < 0.01, ***P < 0.001, ****/####P < 0.0001.
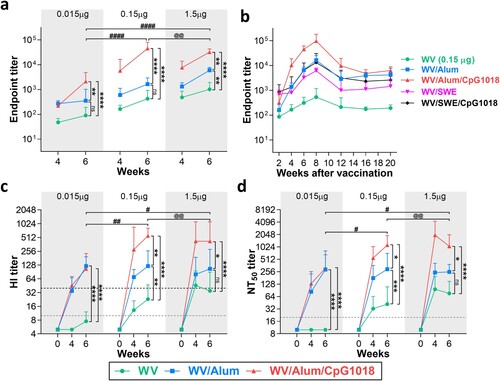
Figure 2. Effects of adjuvants on the H7N9 WV vaccine-induced IgG isotype antibody titres. BALB/c mice (n = 5 per group) were intramuscularly immunized twice with the H7N9 WV vaccine in combination with aluminum hydroxide (Alum) or CpG 1018. Serum samples were collected for humoral immune response evaluation at week 6 after the first immunization. (a, b) Antigen-specific immunoglobulin G subclasses, IgG1 (a) and IgG2a (b), in mouse serum were quantified by ELISA. The log10-transformed IgG1 and IgG2a titres were analyzed by two-way ANOVA with Tukey’s posttest. *P < 0.05, **P < 0.01, ***P < 0.001, ****P < 0.0001.
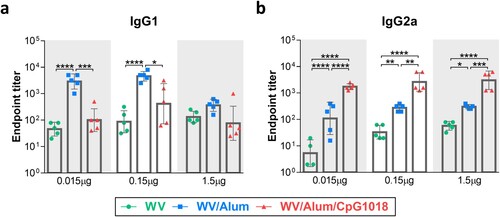
Figure 3. T-cell responses induced by the adjuvanted H7N9 WV vaccine. BALB/c mice (n = 4 per group) were intramuscularly immunized twice with the H7N9 WV vaccine in combination with aluminum hydroxide (Alum) or CpG 1018. Splenocytes were collected at day 7 after the second immunization, and the levels of secreted IFN-γ, IL-2, IL-5 and IL-13 (a–d) were evaluated after restimulation with recombinant H7 protein. (e, f) The ratios of IFN-γ to IL-5 and IFN-γ to IL-13 were calculated. The log10-transformed cytokine level and IFN-γ/IL-5 and IFN-γ/IL-13 ratios were analyzed by two-way ANOVA with Tukey’s posttest. *P < 0.05, **P < 0.01, ***P < 0.001, ****P < 0.0001.
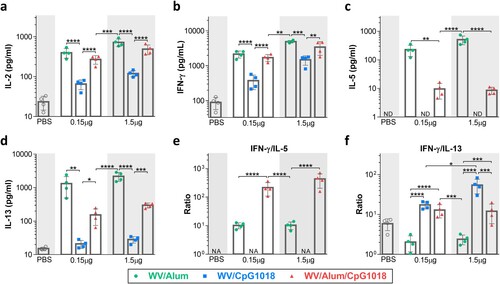
Figure 4. Protective efficacy of the Alum-adjuvanted H7N9 vaccine with or without CpG against H7N9 challenge. BALB/c mice (n = 8 for each group) were intramuscularly immunized twice with PBS or adjuvanted H7N9 WV vaccines. Four weeks after the final immunization, mice were intranasally challenged with (a, b) 2-fold MLD50 or (c, d) 10-fold MLD50 of CBER-RG7D H7N9 virus. (a, c) Survival rate was monitored daily after H7N9 challenge. Significant differences between the PBS group and the other groups were calculated using the log-rank test, **p < 0.01, ***p < 0.001. (b, d) Body weight change (%) of the mice was monitored daily after H7N9 challenge as an indicator of disease progression. Only surviving mice are shown in body weight results that are presented as the mean ± SD. Differences between vaccinated groups in panel b were calculated with two-way ANOVA with Sidak’s posttest. However, significant differences (on day 3 to day 9 postinfection) in panel d were calculated using Student’s t test due to missing data resulting from death. * indicates comparisons between the 1.5 μg HA with Alum and 0.15 μg HA with Alum/CpG groups. # indicates comparisons between the 0.15 and 0.015 μg HA groups with Alum/CpG. @ indicates comparisons between the 1.5 μg HA with Alum and 0.015 μg HA with Alum/CpG groups. */#/@P < 0.05, **/##P < 0.01, ***P < 0.001, ****P < 0.0001. (e) Viral RNA loads (n = 6 for each group) in the lungs of H7N9-infected mice at day 3 postchallenge were quantified by RT-qPCR. Data are presented as the mean ± SD. Differences between groups were calculated using one-way ANOVA with Tukey’s posttest. ****P < 0.0001.
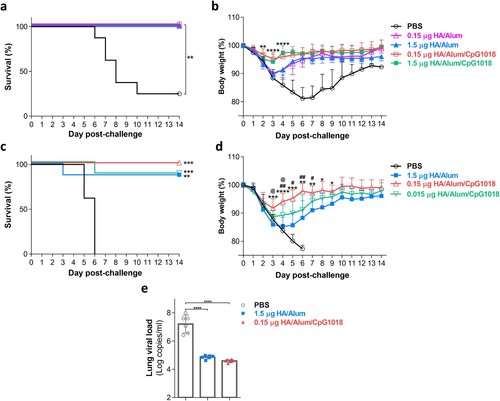
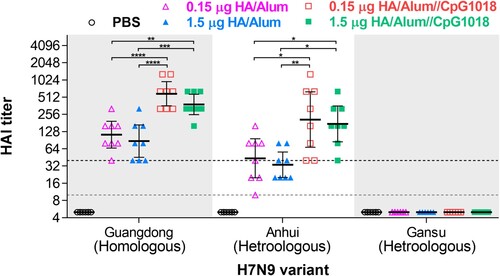
Figure 5. Effects of adjuvants on the H7N9 WV vaccine-induced cross-reactive antibody responses. BALB/c mice (n = 8 for each group) were intramuscularly immunized twice with PBS or adjuvanted H7N9 WV vaccines. Serum samples were collected for cross-reactivity evaluation at week 4 after the first immunization. Homologous hemagglutination-inhibition (HI) titres against CBER-RG7D (Guangdong) and heterologous HI titres against NIBRG-268 (Anhui) and IDCDC-RG64A (Gansu) were quantified by hemagglutination inhibition assay. The gray dashed line indicates a 10-fold initial dilution of serum samples. The black dashed line represents a ≥ 4-fold increase in HI titre. Significant differences between the homologous strain and heterologous strains were calculated using one-way ANOVA with Tukey’s posttest. *P < 0.05, **P < 0.01, ***P < 0.001, ****P < 0.0001.
Supplemental Material
Download PDF (282.4 KB)Data availability statement
The authors declare that the data supporting the findings of this study are available within this paper or are available from the corresponding author upon reasonable request.