
Figures & data
Table 1. Sample intake metadata for foxes with Influenza A diagnostic RT-PCR cycle threshold (Ct ≤ 45) values.
Figure 1. (A) Histologic section shows monocular perivascular cuffing with rarer neutrophils (arrow). Cellular debris and reactive glia are present throughout the grey matter (arrowheads, H&E, bar = 200 microns). (B) Histology of the cerebral cortex illustrating neuronal necrosis (arrows) and small deposits of nuclear debris in the grey matter (arrowheads, H&E, bar = 50 microns). (C) Histology of the lung shows macrophages, neutrophils, and fibrin flooding and obliterating the alveoli. In areas, there is type 2 pneumocyte hyperplasia (arrows, H&E, bar = 100 microns).
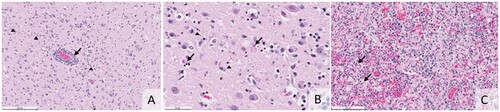
Figure 2. RT-PCR Ct values (column mean, error bars) for each IA matrix positive fox (n = 4) tissue included in the study. The blue star indicates statistically lower Ct values (p = 0.0001) in the brain when compared to the other tissue using two-way ANOVA.
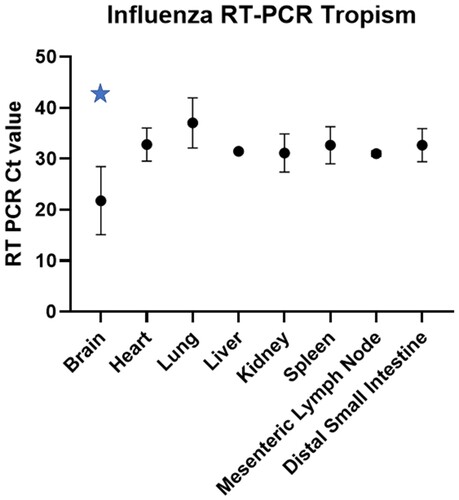
Figure 3. Histological brain sections subjected to Influenza A RNA-ISH at high magnification, size bar at 100 µm, and corresponding Ct value from the Influenza matrix RT-PCR is included. Clustered chromogenic staining indicates highly concentrated RNA signalling in brain lesions.
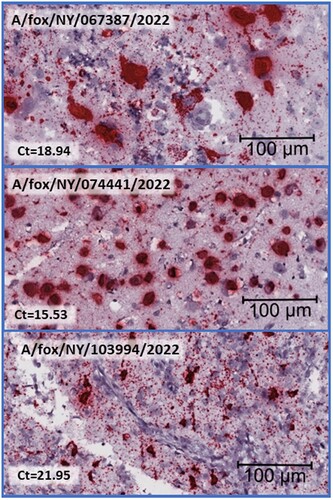
Figure 4. Histological tissue sections subjected to Influenza A RNA-ISH for spleen, heart, kidney (for A/fox/NY/067387/2022 and A/fox/NY/074441/2022) or intestine (A/fox/NY/103994/2022) and lung. Each image is at the same magnification and has a size bar at 100 µm in the lower right-hand corner. Arrows indicate chromogenic viral RNA labelling that may be difficult to locate due to a lower level of virus presence than in brain tissue sections. No staining was observed for A/fox/NY/067387/2022 spleen tissue section. Corresponding RT-PCR Ct values on each of the tissues depicted are included in the upper left-hand corner for each image.
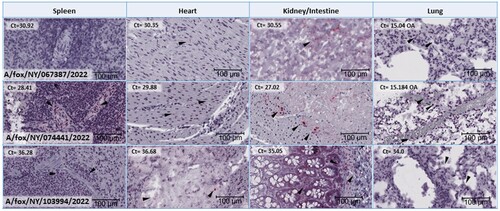
Figure 5. Spatiotemporal spread of H5N1 viruses in foxes. (A) Map the location where each animal was initially found and provide the geographic relation within Upstate NY. The circle size indicates the number of foxes found in that location. (B) Phylogenetic analysis of the HA segment showed that samples found in location contained Influenza strains that were genetically related. (C) Temporal timeline indicating when each fox had been found or collected between April and May 2022, including the genotypic relationship for each of the seven samples that yield 100 percent coverage of each of the eight segments. (D) Two genotypes of Influenza A H5N1 that were found in this study. The colour of the bar indicates the closest donor strain of the gene segment, which can be found in the “Segment Origin” table. The IA virus coloured blue is referred to as genotype 1, and red is genotype 2.
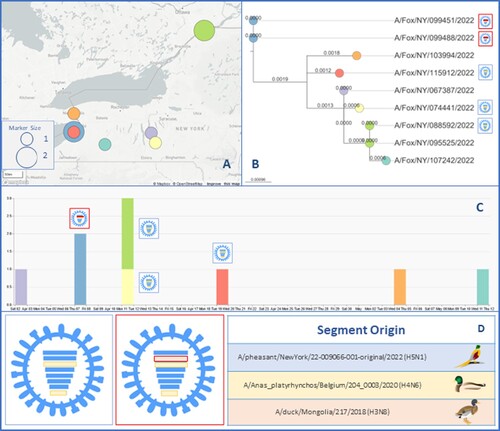
Figure 6. (A) A stacked column chart presenting the number of mammalian HPAI H5N1 sequences worldwide and published on GISAID between 2021 and 2023. The x-axis consists of individual countries in Europe, states in the US, provinces in CA, and Japan. (B) Mutation analysis summary for each of the eight genome segments. Previously reported effects of such mutations, including host-specificity shift, virulence, drug resistance, antigenic drift/escaped mutant are represented with triangles with different colours on each segment with the amino acid location and substitution change, and the number of samples that was observed (total n = 9). More detailed information regarding the mutation, which samples it occurred in, the reference sequence used, and any structural changes, can be found in Supplemental Table 4. HA mutation position nomenclature is based on the classical H3N2 strain.
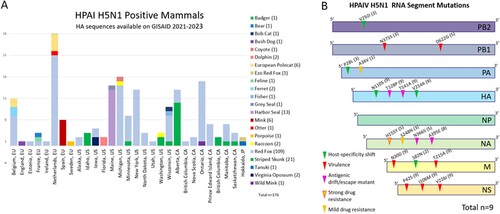
Figure 7. (A) Phylogenetic tree shows that the samples tested in this study cluster with H5 clade 2.3.4.4b, using previously published clade annotations [Citation31,Citation55]. (B) Phylogenetic tree of worldwide mammalian HPAI H5N1 HA GISAID submissions (2021–2023). Sequence names presented from this study are highlighted in red and isolate identification simplified.
![Figure 7. (A) Phylogenetic tree shows that the samples tested in this study cluster with H5 clade 2.3.4.4b, using previously published clade annotations [Citation31,Citation55]. (B) Phylogenetic tree of worldwide mammalian HPAI H5N1 HA GISAID submissions (2021–2023). Sequence names presented from this study are highlighted in red and isolate identification simplified.](/cms/asset/4db3c979-00bb-4fd5-8865-cf12e9eaa709/temi_a_2249554_f0007_oc.jpg)