Figures & data
Figure 1. Population structure and phylogenetic analyses of V. metschnikovi. (a) Phylogenetic ML tree based on cgSNPs with 1000 bootstrap replicates. The red and blue branches represented Lineage 1 (L1) and Lineage 2 (L2), respectively. The purple dots on the top of the branches represented the 17 identified clonal groups (CGs). The inner ring showed different isolation sources, and the outer ring showed different isolation regions. (b) Correlation analysis between genetic distances and geographical distances within L1 strains. (c) Correlation analysis between genetic distances and geographical distances within L2 strains. (d) Splits-tree of phylogenetic networks based on the single-copy genes. (e) Heatmap of paired-SNP variants among 103 V. metschnikovii genomes. The colours from blue to red indicated the increase of SNP number. (f) Comparison of the ratios of six mutagenesis types between L1 and L2. (g) Chord diagram between drug resistance genes (DRG) and V. metschnikovii strains. A total of 17 DRG-positive isolates were identified, including 13 in L1 and 4 in L2.
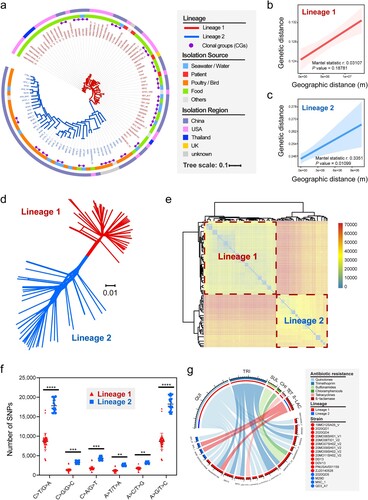
Figure 2. Genetic structures of the 29 V. metschnikovii O-genotypes identified from the V. metschnikovii reference strains. The different colourful arrows indicated the function, location and direction of gene transcripts in the O-AGCs. For putative glycosyltransferases, in green, types of domains families (family 1, 2, 4, UT, untypable) were indicated instead of gene names.
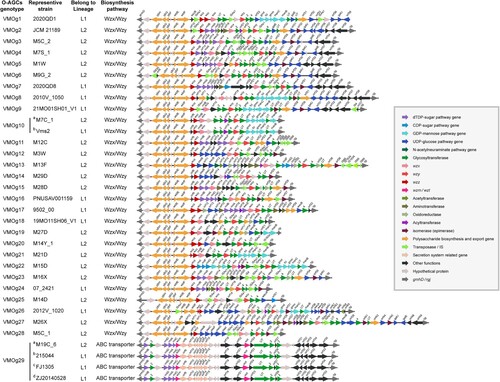
Figure 3. Cytotoxic and genomic-based analyses of the pathogenicity factors in V. metschnikovii. (a) Distribution of virulence-associated genes, O-genotypes, and cytotoxicity ranks. The colours from blue to red represented the identity of the gene sequences. The detail of the different cytotoxicity ranks and O-genotypes are listed on the right. (b) Cytotoxicity value of 30 V. metschnikovii strains. Low cytotoxicity (below 0.3), medium cytotoxicity (between 0.3 and 0.5) and high cytotoxicity (above 0.5). Vibrio cholerae strain N16961 (O1 biovar El Tor) and MO45 (O139) served as cytotoxicity positive controls. (c) Principal component analysis (PCA) of virulence genes for the 30 V. metschnikovii strains. The colours from blue to red represented the values of cos2, and the sizes of the circles represented the contributions of each strain sample. Gene lfhA (accession: VF0474) was described in the VFDB database as a gene encoding lateral flagellar biosynthesis protein in Aeromonas genus. The nomenclature of the flhA gene in V. parahaemolyticus was used for the sake of uniform description [Citation55]. (d) Relationships among cytotoxicity levels, O-genotypes, and virulence factors, according to the binary logistic regression model used in this study. Virulence factors associated with the lateral flagella and the T6SS are marked with red dashed boxes.
![Figure 3. Cytotoxic and genomic-based analyses of the pathogenicity factors in V. metschnikovii. (a) Distribution of virulence-associated genes, O-genotypes, and cytotoxicity ranks. The colours from blue to red represented the identity of the gene sequences. The detail of the different cytotoxicity ranks and O-genotypes are listed on the right. (b) Cytotoxicity value of 30 V. metschnikovii strains. Low cytotoxicity (below 0.3), medium cytotoxicity (between 0.3 and 0.5) and high cytotoxicity (above 0.5). Vibrio cholerae strain N16961 (O1 biovar El Tor) and MO45 (O139) served as cytotoxicity positive controls. (c) Principal component analysis (PCA) of virulence genes for the 30 V. metschnikovii strains. The colours from blue to red represented the values of cos2, and the sizes of the circles represented the contributions of each strain sample. Gene lfhA (accession: VF0474) was described in the VFDB database as a gene encoding lateral flagellar biosynthesis protein in Aeromonas genus. The nomenclature of the flhA gene in V. parahaemolyticus was used for the sake of uniform description [Citation55]. (d) Relationships among cytotoxicity levels, O-genotypes, and virulence factors, according to the binary logistic regression model used in this study. Virulence factors associated with the lateral flagella and the T6SS are marked with red dashed boxes.](/cms/asset/e1163ab6-cafd-4365-a6d4-461638a21900/temi_a_2252522_f0003_oc.jpg)
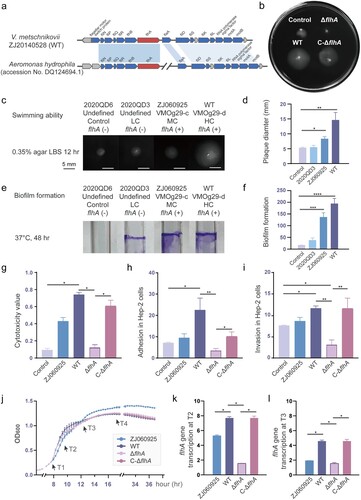
Figure 4. Genetic and functional analyses of lateral flagellar related flhA gene. (a) Gene cluster organization of a 15.8 kb fragment surrounding the flhA gene in the V. metschnikovii chromosome. (b) Swimming motility patterns of the ZJ20140528 (WT), the flhA mutant (ΔflhA), the complemented flhA mutant (C-ΔflhA) and control (2020QD6) strains. (c) Swimming motility of four representative V. metschnikovii strains for 12 h on soft agar (0.35%) and (d) statistical analysis. Strain ZJ20140528 for high cytotoxicity, VMOg29-d and flhA positive; strain ZJ060925 for median cytotoxicity, VMOg29-c and flhA positive; strain 2020QD3 for low cytotoxicity, VMOg-undefined and flhA negative; strain 2020QD6 for control, low cytotoxicity and flhA negative. (e) Crystal violet staining for 48 h and (f) statistical analysis. (g) Cytotoxicity values of five V. metschnikovii strains. (h) Adhesion ability in Hep-2 cells. (i) Invasion ability in Hep-2 cells. (j) Growth curves. The four time points (T1 to T4) for subsequent RT-qPCR were marked with black arrows. (k) Transcription levels of flhA gene at T2. The 16S rRNA gene was used as an internal control. All primer sequences were shown in Table S8. (l) Transcription levels of flhA gene at T3. Those groups with significant differences were marked with * (P < 0.05), ** (P < 0.01), *** (P < 0.001), **** (P < 0.0001).