Figures & data
Figure 1. mRNA design and protein expression in transfected HEK293 T cells. (A) Schematic diagram of the design of MLN-mRNA vaccine. Codon-optimized M2e, LAH and NP sequences were inserted into the region between 5’UTR and 3’UTR. SP represents signal peptide. (B) Expression of MLN-mRNA-encoded proteins measured by immunoblotting. Samples were cell lysates from MLN-mRNA-transfected HEK293 T cells.
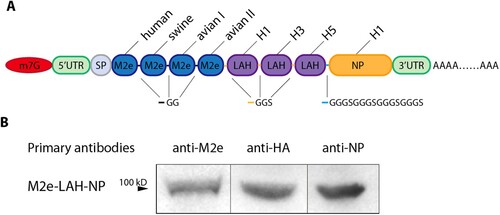
Figure 2. MLN-mRNA vaccination elicited humoral immune responses. (A) Schematic of the immunization, virus challenge and sampling strategy. BALB/c mice were immunized intramuscularly with MLN-mRNA vaccine (5, 10, 20 μg) following a prime-boost program, followed by viral challenge and tissue sample collection. (B) Measurement of M2e-/LAH-/NP- specific IgG antibodies post-prime or boost. IgG levels against M2e/LAH peptides or NP protein in mice serum were analysed by ELISA. (C) Isotypes of NP-specific IgG antibodies were determined using anti-mouse immunoglobin isotype-specific antibodies. (D and E) Antigen-specific antibody-secreting cells were analysed by B-cell ELISpot assay. Spot-counting for M2e-/LAH-/NP-specific antibody-secreting cells in spleen seven days post-prime or boost (D). Spot-counting for M2e-/LAH-/NP-specific antibody-secreting cells in spleens, lungs, and lymph nodes seven days post boost (E). (F) ADCC activities of sera were measured using a reporter assay to determine the engagement with mouse FcγR. Three technical replicates were conducted for each sample, and curves were fit using a non-linear regression formula (four parameter logarithmic). (G) The proportion of splenic GC B cells (GL7 + CD95+) in B cells collected from the 20 μg vaccine-treated mice seven days post-prime or boost. (H) The proportion of splenic TFH cells (CD4 + PD1 + CXCR5) in the CD4+ T population collected from the 20 μg vaccine-treated mice seven days post-prime or boost. Statistical significance was calculated by one-way ANOVA; *P < 0.05; **P < 0.01; ***P < 0.001; ****P < 0.0001. Data represents mean value and error bars for SEM.
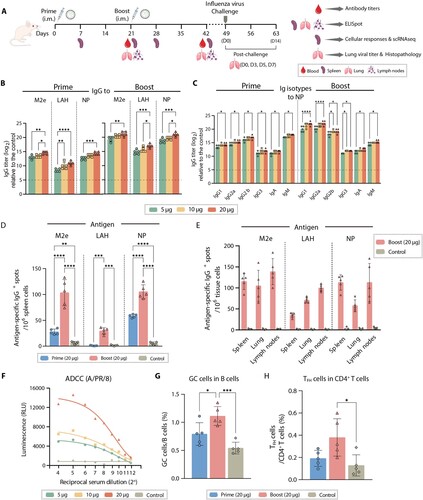
Figure 3. MLN-mRNA vaccination induced cellular immunity. (A to C) Splenic lymphocytes were collected 21 days post boost, followed by re-stimulation using a mixture of M2e, LAH and NP (4:3:1, molar ratio). IFN-γ (A) and IL-4 (B) in the conditional media were detected using ELISA. (C) Ratio between IFN-γ and IL-4 level is used to represent TH1-biased immune response. (D) Quantification of re-stimulated IFN-γ-secreting T cells by ELISpot assay in spleens, lungs, lymph nodes 21 days post boost after a two-day-stimulation with M2e-LAH-NP mixture. (E and F) Multifunctional cytokine analysis of CD4+ and CD8+ T cells in spleens of immunized mice on day 7 post-prime or boost in the high dosage group (20 μg). After stimulated by M2e-LAH-NP mixture for 6 h, spleen cells were stained for intracellular cytokines and analysed by flow cytometry. (G to I) T cell memory induced by MLN-mRNA vaccine. The proportion of CD4+ and CD8+ T cells (G), CD8+ TCM (CD8 + CD44 + CD62L+) and CD8+ TEM (CD8 + CD44 + CD62L-) (H), CD4 + TRM (CD4 + CD69 + CD103+) and CD8 + TRM (CD8 + CD69 + CD103+) cells (I) at days 7 post-prime or boost in splenic lymphocytes. Statistical significance was calculated by one-way ANOVA; *P < 0.05; **P < 0.01; ***P < 0.001; ****P < 0.0001. Data represents mean value and error bars for SEM.
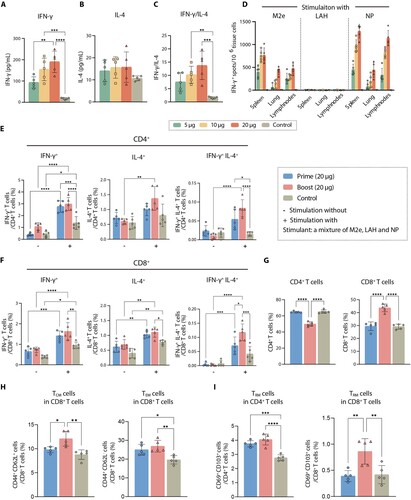
Figure 4. MLN-mRNA vaccination protected mice from influenza virus challenge. (A to C) Body weight measurement and survival curves of mice. Adult mice (n = 10) were immunized twice with 5, 10, 20 μg of the MLN-mRNA vaccine and were challenged after 4 weeks post boost injection with a lethal doses (5×LD50) of H1N1 (A/PR/8), H3N2 (A/GZ), or H9N2 (A/JS) virus. Body weight was monitored daily for 14 days post-infection. Statistical significance was calculated by Student’s t-tests (two-tailed). (D) Mice (n = 5) were euthanized at days 3, 5 and 7 post-challenge with H1N1 (A/PR/8), and their lungs were harvested and homogenized for viral titre determination by TCID50. The homogenates were also used for determination of granzyme B (E) and perforin 1 (F) by ELISA. (G) Hematoxylin and eosin (H&E) staining of the lung sections. Lungs were collected 3, 5 and 7 days post-infection. (H and I) Mice (n = 10) were immunized twice with 20 μg of the MLN-mRNA vaccine and were intraperitoneally received with control, CD4- or CD8-depleting antibodies at −2 days and +1 d of challenge. All mice were challenged with a lethal dose (5×LD50) of H1N1 (A/PR/8). Body weight, survival curves for mice (H), and lung viral titres (I) at day 5 post-infection. Statistical significance was calculated by one-way ANOVA; *P < 0.05; **P < 0.01; ***P < 0.001; ****P < 0.0001. Data represents mean value and error bars for SEM.
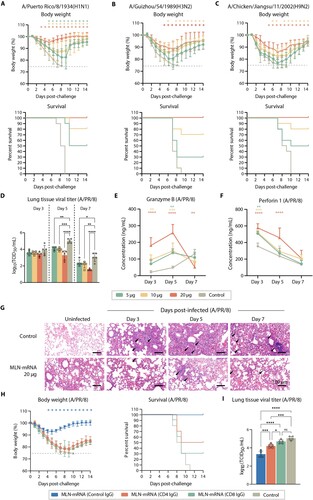
Figure 5. Single-cell sequencing analysis of spleen CD3+ T cells. (A) UMAP clustering of sequenced splenic cells. (B) Clustering of CD8+ T cell subtypes within each group. CD8+ T cells are classified into nine subtypes as indicated. (C) Histogram showing the proportion of different CD8+ T cell subtypes in each sample. (D) Violin plots showing the expression of effect and tissue resident memory CD8+ T cell markers being significantly upregulated in the prime-boost group. (E) Heatmap showing the pathways that are significantly different between the prime-boost group and the other two groups in the CD8+ cells, which are the results of variation analysis using the GSVA method.
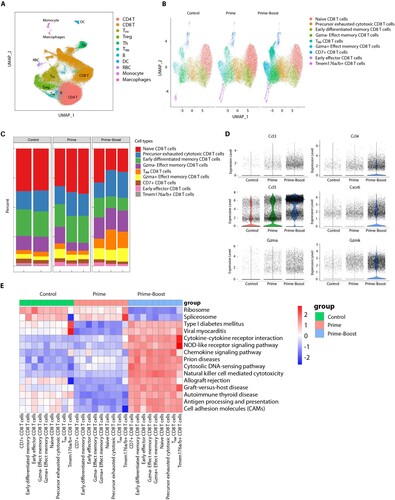
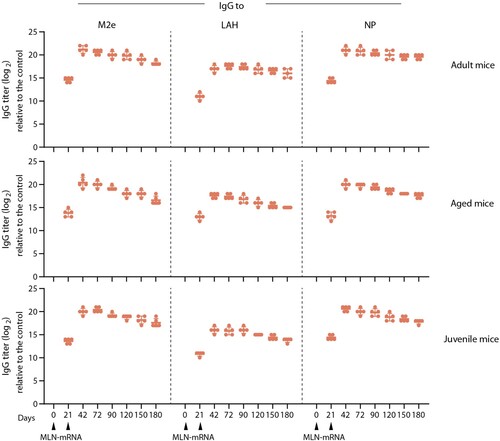
Figure 6. Immunogenicity of MLN-mRNA vaccine in adult, aged and juvenile mice. Adult (6-8 weeks old, upper panel, n = 5) or juvenile (3-4 weeks old, lower panel, n = 5) were immunized twice as indicated with 20 μg of MLN-mRNA. Aged mice (8 months old, middle panel, n = 5) were exposed to sublethal dosage of A/PR/8 infections one month before the primary immunization and then vaccinated with 20 μg MLN-mRNA twice as indicated. Anti-M2e/LAH/NP antibody titres were monitored by ELISA for 6 months.