
Figures & data
Figure 1. The flowchart of this study. An overview of the study population is provided for both the telephone cohort and the sample cohort.
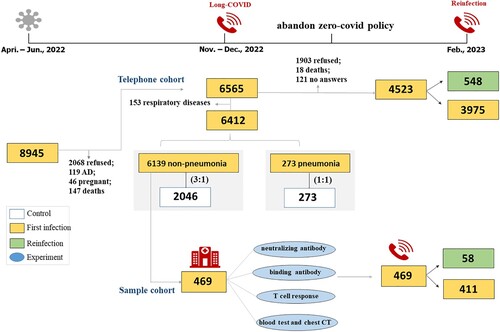
Table 1. Characteristics of COVID-19 and control groups.
Table 2. Comparison of persistent symptoms among COVID-19 and common respiratory tract infection groups.
Figure 2. Factors associated with persistent symptoms. Risk of at least one sequelae (A), fatigue (B), mental (C), and respiratory symptoms (D) are plotted. Incident outcomes were assessed from viral RNA shedding to the end of the follow-up. RRs were calculated using multivariable Poisson regression adjusting for sex, age, BMI, disease severity during the infection, smoking status, doses of vaccination, the number of comorbidity, and viral RNA shedding time. Adjusted RRs (squares) and 95% CIs (error bars) are presented. RR = rate ratio.
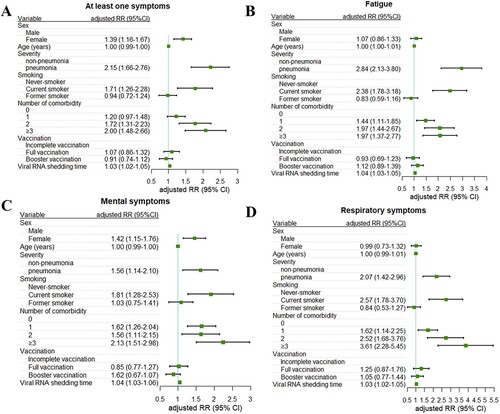
Figure 3. The Omicron BA.2 NAb titres of 469 participants who came to the hospital. The NAb titres among participants with different doses of vaccination (A) and between long-COVID and non-long-COVID (B). A comparison of NAb between reinfection and non-reinfection (C) and stratified by doses of vaccination (D). Mann-Whitney U test was used to calculate P values. Nab = neutralizing antibody; NS. = no significance; *P < 0.05, **P < 0.01, ***P < 0.001.
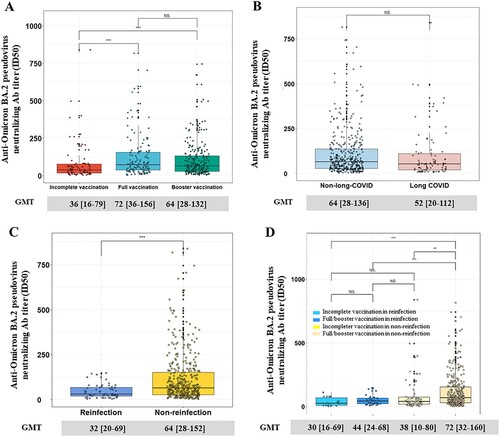
Table 3. The efficacy of hybrid immunity in protecting from reinfection.