Figures & data
Figure 1. High expression of PGE2 pathway components is observed in active CL lesions. Unbiased RNAseq was performed on skin samples from 7 healthy subjects and lesions from 21 CL patients. Heatmap columns and rows representative of individuals and genes, respectively. Heatmap colour reflects raw z-scores of gene abundance across samples.
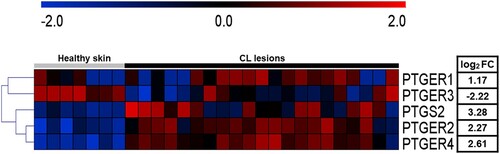
Figure 2. Increased PTGS2 gene expression at the lesion site is associated with parasite load and clinical outcome. RNAseq data (from 21 lesions) was used to investigate correlations between gene PTGS2 and number of L. braziliensis transcripts. The mean expression of PTGS2 was used as a cut-off point to determine high or low expression. L. braziliensis transcript number presented as median and interquartile range, with red bar indicating the group with high expression from PTGS2 and blue bar low expression. Statistical analysis performed using Pearson's testing for correlations (A); the Mann–Whitney test was used for comparing parasite load in groups with high and low PTGS2 expression (B); Kaplan-Meier survival analysis of groups with respect to therapeutic failure (C) *P < 0.05.
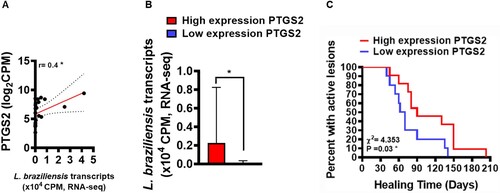
Figure 3. High frequency of COX-2+ cells at the lesion site is associated with parasite load, disease severity and therapeutic failure. Lesion biopsies from CL patients (n = 11) and skin samples from healthy subjects (n = 8) were obtained using a 4 mm punch. Black arrows indicate the presence of L. braziliensis amastigotes in CL lesions (A), cells immunostained with polyclonal antibody anti-COX2 in healthy skin (B) and CL lesions (C), respectively. COX-2+ cell frequency presented as mean and standard deviation: black bar indicates healthy skin while grey bar represents CL lesions (D). Blue bar indicates patients that evolved to cure, while the red bar patients those that failed therapy (E) Correlation between number of amastigotes and frequency of COX-2+ cells (F), and correlation between number of lesions and frequency of COX-2+ cells (G). Statistical analysis performed using the Unpaired t-test to compare COX-2+ frequency, with Pearson's testing used for correlation analysis; *P < 0.05, ****P < 0.0001.
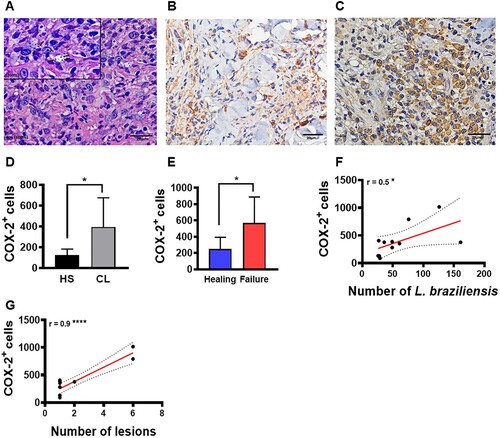
Figure 4. PGE2 production in active lesions correlates with disease severity. Lesion biopsies from CL patients (n = 11) and skin samples from healthy subjects (n = 8) were obtained using a 4 mm punch and cultured for 72 h. PGE2 levels were determined in culture supernatants by ELISA. (A) Levels of PGE2 presented as mean and standard deviation. (B) Correlation between number of lesions and PGE2 levels. Statistical analysis performed using the Unpaired t-test to compare PGE2 levels, while Pearson's testing was used for correlation analysis; *P < 0.05.
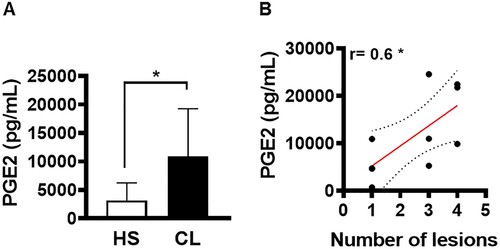
Figure 5. High levels of PGE2 in macrophages infected with L. braziliensis correlate with treatment duration. Monocyte-derived macrophages obtained from CL patients (n = 7) were infected with stationary-phase L. braziliensis (5:1) and cultured for 2, 48 or 72 h. PGE2 levels were determined in culture supernatants by ELISA. (A) PGE2 levels presented as mean and standard deviation. (B) Correlation between rounds of Glucantime® and PGE2 levels. Statistical analysis performed using the Unpaired t-test to compare the PGE2 levels, while Pearson's testing was used for correlation analysis between lesion number and PGE2 levels; *P < 0.05.
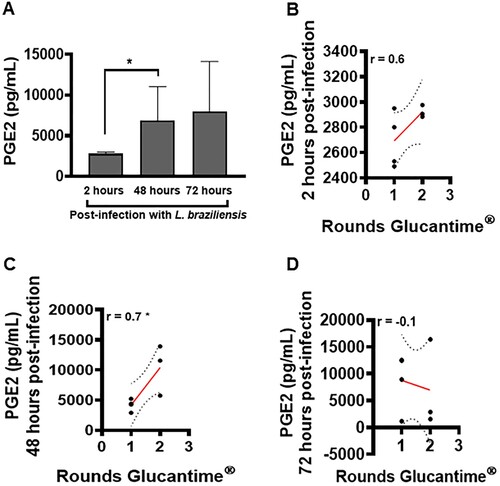
Figure 6. Ability of PGE2 to alter macrophages cytokine production. Monocyte-derived macrophages from HS (n = 5) were cultured in the presence or absence of PGE2 (10 ng/mL) for 72 h. The levels of (A) TNF, (B) IL-1β, (C) IL-6 and (D) IL-10 were determined in culture supernatants by ELISA. Statistical analysis performed using the Wilcoxon test; *P < 0.05.
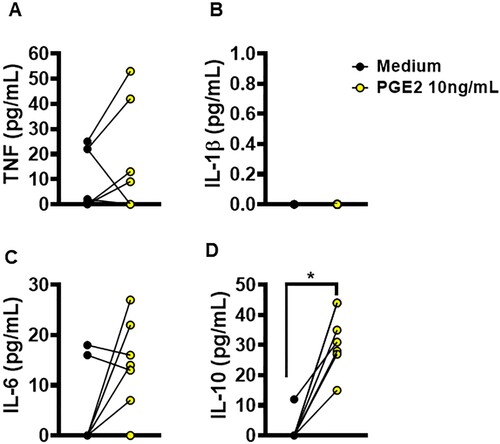
Figure 7. Neutralization of COX-2 increases L. braziliensis killing by macrophages obtained from CL patients. Monocyte-derived macrophages from CL patients (n = 7) were infected with stationary-phase L. braziliensis (5:1) and cultured in the presence or absence of NS398 (100 µM), a selective COX-2 inhibitor, for 2, 48 or 72 h. (A) Frequency of infected cells. (B) Number of amastigotes per 100 macrophages. Results presented as mean and standard deviation, with black bars indicating macrophages infected with L. braziliensis, and white bars macrophages infected with L. braziliensis treated with NS398. Statistical analysis performed using the Paired t-test; *P < 0.05, **P < 0.005, ***P < 0.001.
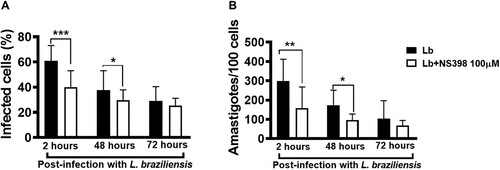
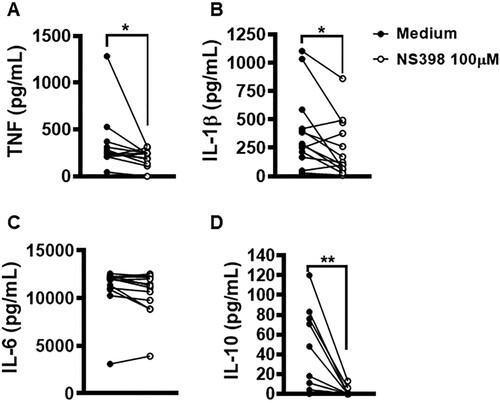
Figure 8. Neutralization of COX-2 in lesion cells decreases production of IL-1β, TNF and IL-10. Skin lesion biopsies from CL patients (n = 13) were obtained using a 4 mm punch and cultured for 72 h. Levels of (A) TNF, (B) IL-1β, (C) IL-6 and (D) IL-10 were determined in culture supernatants by ELISA. Statistical analysis performed using Wilcoxon's test; *P < 0.05 and **P < 0.005.