Figures & data
Figure 1. Comprehensive analysis of 8-bromobaicalein and baicalein, (A) antiviral efficacy in CHIKV (M.O.I. of 0.1) infected Vero cells for 72 h. Supernatants were analyzed by plaque titration. (B) Molecular docking-based prediction of CHIKV protein targets. (C-D) Binding conformation of 8-Bromobaicalein and baicalein compared to GTP at nsP1. (E) Fragment molecular orbital calculation-based assessment of energy contribution and key interacted residues for 8-bromobaicalein and baicalein.
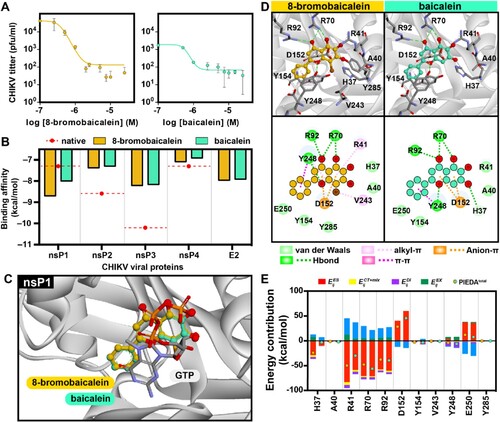
Figure 2. Hepatorenal toxicity of 8-bromobaicalein (250 mg/kg, per oral (PO), single dose, n = 5) measured by (A) alanine transaminase and (B) creatinine levels on day 1, 3, and 7 after administration. (C) Scheme of 8-bromobaicalein pharmacokinetic analysis and plasma concentration-time profiles (created by Biorender) (D) intravenous (IV) and (E) PO routes of administrations (n = 5). Effective concentrations at 50, 90, 99, and 99.9 were plotted to demonstrate the level of drug in systemic circulation. Data represented means and standard deviation of the tested samples.
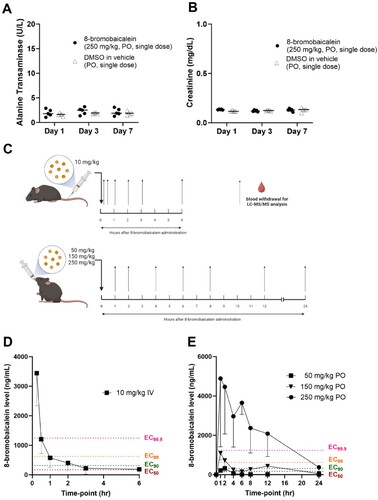
Table 1. Pharmacokinetic parameters of 8-bromobaicalein.
Figure 3. In vivo efficacy of 8-bromobaicalein against CHIKV-induced musculoskeletal inflammation (A) Scheme of experimental procedure, and clinical parameters (created by Biorender) (B) activity score, (C) body temperature, (D) foot width change, and (E) foot length change. Data represented means and standard deviation (SD) and *, ** represented the significant difference at p < 0.05, p < 0.01, respectively using one-way ANOVA. Ns represented non-significant difference.
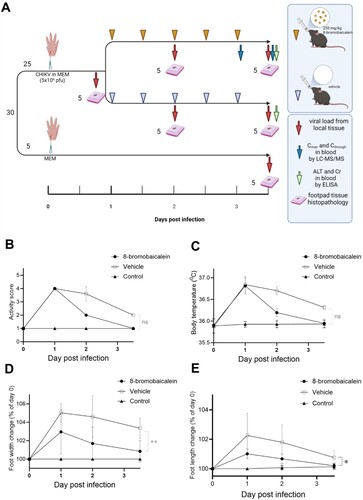
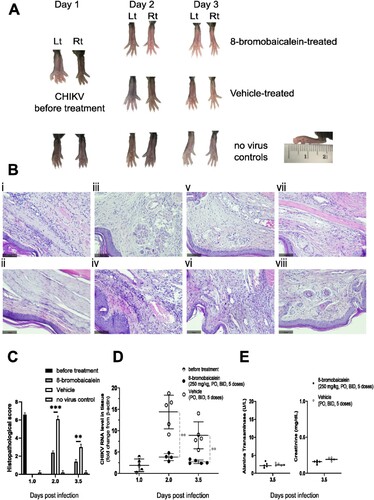
Figure 4. Pathology of the In vivo efficacy experiment. The experimental procedure was shown in A. (A) Gross examination and (B) histopathology by H & E staining of the (i–vi) Lt footpad tissues under the following conditions; (i) CHIKV-infection before treatment (day 1), (ii) no infection control (day 3.5), (iii) 8-bromobaicalein (day 2), and (iv) vehicle-treated (day 2), (v) 8-bromobaicalein (day 3.5), and (vi) vehicle-treated (day 3.5). The Rt footpad tissues were shown in (vii) 8-bromobaicalein (day 3.5), and (viii) vehicle-treated (day 3.5). The slice thickness was 0.3 mm, stained by H&E, and the scale bar (100 µm) was indicated. (C) Histopathological scores, (D) CHIKV RNA level in tissue samples were demonstrated in before treatment (day 1), 8-bromobaicalein-treated (day 2–3.5), and vehicle-treated (day 2–3.5) groups. PO represented per oral, and BID represented twice a day administration, respectively. (E) ALT and Cr levels of drug-treated, and vehicle-treated groups (day 3.5) were evaluated for potential hepatorenal toxicity. An unpaired t-test was used and ** indicated a significant difference at p < 0.01.