Figures & data
Figure 1. The nasal microbiome composition of the test subjects. (A) Relative abundance of the major phyla in the NDM and the DM groups. (B) Bray-Curtis dissimilarity of the two groups (phylum level). Statistical analysis was done by 1-way ANOVA and Tukey’s post-test. Error bars show minima and maxima. (C) Relative abundance of major genera in the nasal microbiome of single individuals in the NDM and the DM groups. (D) The abundance of major genera in the NDM and the DM groups. Bars depict means; error bars indicate SD. NDM, non-diabetes; DM, diabetes. Statistical evaluation was analysed by ANCOM. ***P < 0.001.
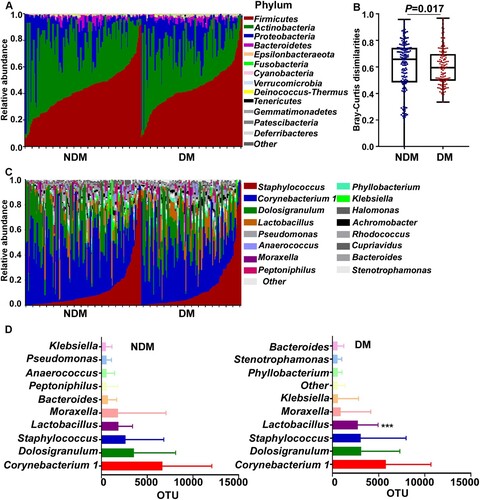
Figure 2. Distinct sequence types of S. aureus colonize the NDM and the DM groups. (A) The abundance comparison of the top three genera. (B) The abundance of S. aureus was assessed by TaqMan qPCR assay of the nuclease (nuc) gene. The results are presented as the mean ± SD. Statistical significance was evaluated by the Kruskal-Wallis test, followed by Dunn’s multiple comparisons test. *P < 0.05. (C) The culture-based analysis of Staphylococcus species in the NDM and the DM groups. (D) The MLST types of 60 S. aureus strains selected from each test group. Sixty strains were randomly selected and tested by PCR. NDM, non-diabetes; DM, diabetes.
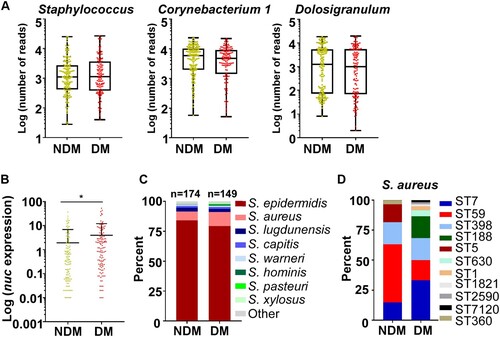
Figure 3. The effect of fasting blood glucose (FBG) concentration on bacterial colonization. (A) Relative abundance of the major phyla in investigated individuals with different glucose concentration in the DM group. (B) Bray-Curtis dissimilarity of individuals with different blood glucose concentration in the DM group (phylum level). Statistical analysis is by 1-wayANOVA and Tukey’s post-test. Error bars show minima and maxima. (C) Relative abundance of major genera in the nasal microbiome of single individuals in the DM group. (D) Abundance of Staphylococci of single individuals in the DM group. Error bars show minima and maxima. Statistical evaluation was analysed by ANCOM. ***P < 0.001. (E) The abundance of S. aureus was determined in diabetes patients with different FBG concentration using a TaqMan qPCR assay targeting the nuclease (nuc) gene. The results are presented as the mean ± SD. Statistical evaluationswere performed using the Kruskal-Wallis test following by Dunn’s multiple comparisons test. ****P < 0.0001. (F) The culture-based analysis of Staphylococcus species in diabetes patients with different FBG concentration. (G) S. aureus MLST typing was analysed in the NDM group with normal FBG level and diabetic patients with different FBG concentration . Glc, glucose.
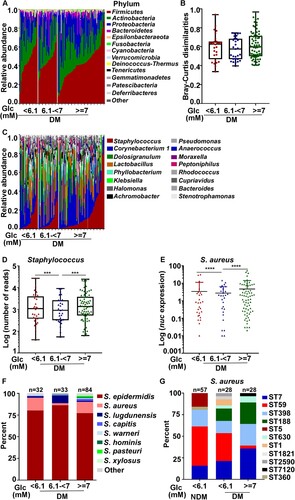
Figure 4 .#The antimicrobial resistance and biofilm formation of S. aureus ST7 and ST59 strains. (A) The antimicrobial activity of coagulase-negative Staphylococcus is not significantly different among isolates from patients with different levels of fasting blood glucose levels. (B) The resistance to two human antimicrobial peptides was compared for 9 randomly selected ST7 and ST59 strains. The bacteria were grown to the exponential growth phase and mixed together with hBD3 (75 μg/ml) or LL37 (75 μg/ml). After 3 h incubation at 37°C, bacteria were spread on sheep blood agar for CFU counting. (C) The randomly selected strains were also subjected to the biofilm formation assay. The strains were grown in TSB with different concentrations of glucose at 37°C for 24 h in a 96-well plate. The data were collected from three biological repeats. The statistical significance was measured by unpaired, two-tailed Student’s t test. *P < 0.05; **P < 0.01; ***P < 0.001.
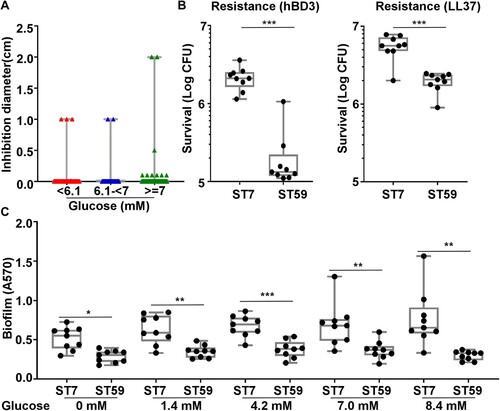
Figure 5. S. aureus ST7 cause more severe skin infection compared with ST59 in mouse model. The naked mouse or the non-diabetic mouse (one mouse / isolate, n = 9 mice/group) was infected with the test ST7 and ST59 strains (108 CFU) via a subcutaneous injection. Skin abscesses of the infected mice were observed on day 2 after infection. (A) Abscess pictures for naked mouse. (B) Abscess sizes measured 2 d post-infection for naked mouse. (C) Bacterial loads in the infected skin tissues of naked mouse. (D) Histopathological analysis of skin abscess of naked mouse. Representative pictures are shown. (E) Levels of cytokine il6 gene expression 2 d -abscesses of naked mouse determined by qRT-PCR. (F) Abscess pictures for non-diabetic mouse. (G) Abscess sizes measured 2 d post-infection for non-diabetic mouse. (H) Bacterial loads in the infected skin tissues of non-diabetic mouse. The diabetic mouse model (n = 5 mice/group) was infected with a representative strain of ST7 or ST59 (108 CFU) by subcutaneous injection. (I) Abscess pictures. (J) Abscess sizes measured 2 d post-infection. (K) Bacterial loads in the skin tissues. The data were collected from two biological repeats. The statistical significance was measured by unpaired, two-tailed Student’s t test. *P < 0.05; **P < 0.01; ***P < 0.001.
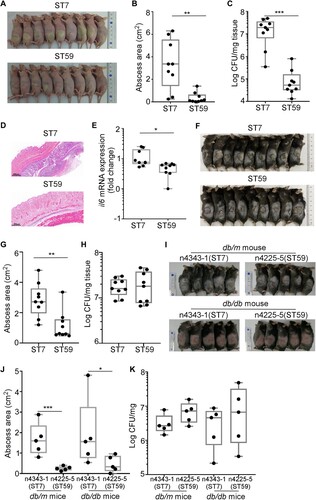
Figure 6. S. aureus ST7 strains have a higher SaeRS activity than the ST59 strains. (A) The expression of the main virulence regulators was compared between S. aureus ST7 and ST59. (B) The expression of Sae-targets genes with low affinity were compared between S. aureus ST7 and ST59. (C) The expression of hla with high affinity to SaeRS TCS were compared between S. aureus ST7 and ST59. (D/E) The expression of SaeRS-unrelated genes were compared between S. aureus ST7 and ST59. The transcript levels were measured by qRT-PCR, using gyrB as a reference. The data were collected from three biological repeats. The statistical significance was measured by unpaired, two-tailed Student’s t test. *P < 0.05;**P < 0.01; ***P < 0.001.
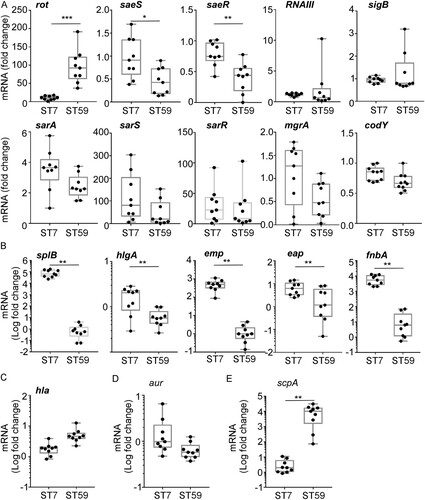
Figure 7. SaeRS is critical for the growth and colonization advantage of S. aureus ST7 over ST59 . The competition was tested between ST7-n4343-1 and ST59-n4225-5 (A) and the corresponding sae deletion mutant strains (B) by co-culture the two strains in synthetic nasal medium (SNM3). The data were collected from three biological repeats and the statistical significance was measured by one-way ANOVA. (C) The competition was tested between another 4 pairs of strains from DM and NDM group by co-culture each pair of strains in SNM3. The strains were listed in Table S3. The data were polled from two biological repeats with three replicates every time and the statistical significance was measured by unpaired, two-tailed Student’s t test. (D) The blood glucose contents were compared between wild-type mouse (db/m) and diabetic mouse (db/db). (E) The nasal colonization of ST7-n4343-1 and ST59-n4225-5 was compared in diabetic mouse (db/db). (F) The competition between ST7-n4343-1 and ST59-n4225-5 and the corresponding sae deletion mutant strains was compared between wild-type mouse (db/m) and diabetic mouse (db/db). The bacterial CFU was determined after co-culture for 6 h in SNM3 or 2 days after nasal colonization in vivo. The two strains were differentiated by the resistance to erythromycin. The data for the animal test were repeated twice. The statistical significance was measured by unpaired, two-tailed Student’s t test. *P < 0.05; **P < 0.01; ***P < 0.001.
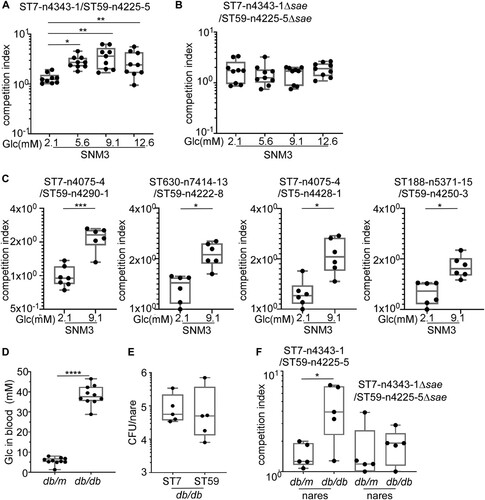
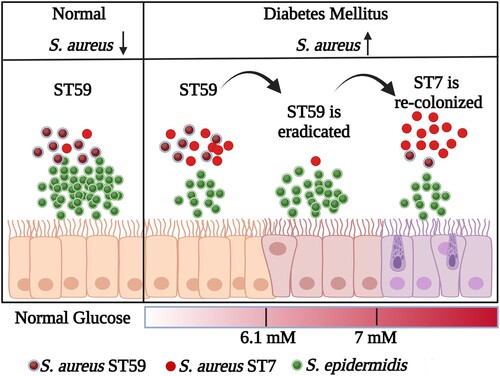
Figure 8. The model for the replacement of S. aureus ST types with the increase of glucose. The graphic is created with BioRender.com.