
Figures & data
Figure 1. SARS-CoV-2 VOCs Delta and D614G productively infect hLOs, while Omicron is attenuated. (a) Schematic of hLO infection. Viral load in infected hLOs was measured by qRT-PCR for gRNA (b–c) or sgRNA (d-e) and averaged across hLOs from four donors. In each run, standard dilutions of counted RNA standards were run in parallel to calculate copy numbers in the samples. gRNA (c) or sgRNA (e) copy numbers over time were used to calculate area under the curve (AUC) relative to 0 h post-inoculation for each donor. (f) In situ hybridization against SARS-CoV-2 spike RNA was conducted in FFPE sections of hLOs 72 h post-inoculation. hLO 1 is shown. Scale bars denote 50 μm (upper panels) or 20 μm (lower panels). (g) Virus titers in the culture supernatant were quantified, and averaged across hLOs from four donors. Dotted line indicates lower limit of detection. (h) Virus titer over time was used to calculate AUC for each donor. Error bars denote mean +/− SEM. Statistical analysis was performed using two-way ANOVA with Dunnett’s post-test (b, d, g) or ordinary one-way ANOVA with Tukey’s post-test (c, e, h). P-values denote difference vs 0 h post-inoculation (b, d, g). P-values <0.05 are shown.
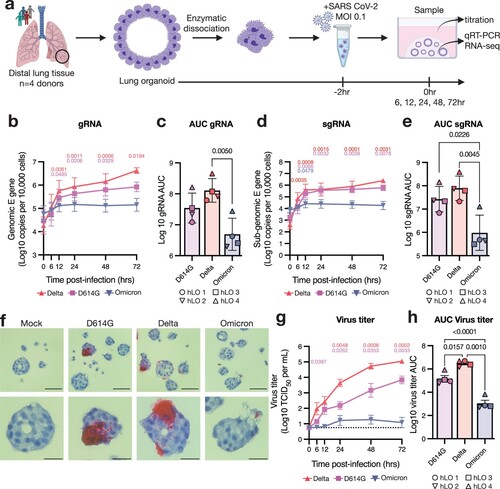
Figure 2. Variable susceptibility to SARS-CoV-2 VOC infection in hLOs derived from different donors. (a) Virus titers in culture supernatant were quantified. Dotted line indicates lower limit of detection. (b) Virus titer over time was used to calculate AUC for each donor. Mean +/− SEM of n = 3 replicates per donor hLO are shown. Statistical analysis was performed using one-way ANOVA with Tukey’s post-test (b). P-values <0.05 are shown.
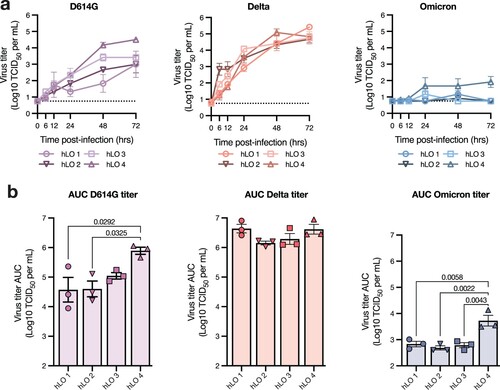
Figure 3. hLOs survive infection with SARS-CoV-2. hLO survival was analyzed over time after infection using the ApoTox-Glo triplex assay. hLO viability (a), cytotoxicity (b), and apoptosis (c) was blank-subtracted and normalized to hLO donor- and timepoint-matched mock-infected controls. Staurosporine was used as a positive control for cell death in these assays; the mean +/− SEM of staurosporine-treated samples is marked in gray shading. Mean +/− SEM of n = 4 hLO donors are shown. (d) Brightfield microscopy images of hLOs 72 h post-infection, or 6 h post-staurosporine treatment. (e) Viability, cytotoxicity, and apoptosis measurements for hLO 4, as in a–c. Mean +/ SEM of n = 3 hLO 4 replicates are shown. Statistical analysis was performed using two-way ANOVA with Dunnett’s post-test. P-values indicate difference vs mock-infected controls, values <0.05 are shown. RFU: relative fluorescence units, RLU: relative luminescence units.
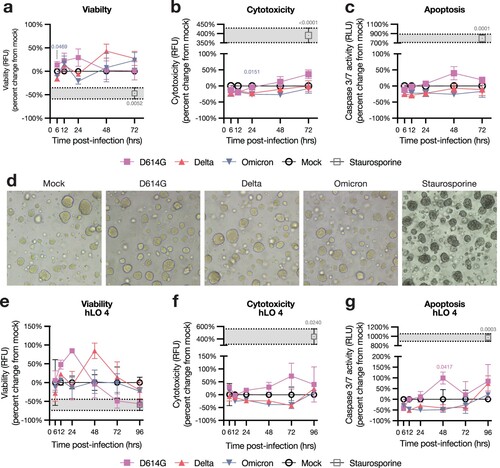
Figure 4. Transcriptional response to SARS-CoV-2 infection is distinct in hLO 4. (a–c) Principal component analysis (PCA) was conducted on VST-normalized gene counts. Axes are labelled with the principal component and the percentage of total variation captured by the component. Samples are plotted on principal components illustrating variation according to hLO donor (a), time post-infection (b), or infection status (c). Ellipses indicate two standard deviations from the group mean. PERMANOVA was computed on a weighted pairwise Minkowski distance matrix (see Supplementary d). F-statistics and p-values are shown for the difference between hLO donor (a), time post-infection (b), or mock vs D614G- and Delta-infected samples (c). (d) Gene set enrichment analysis (GSEA) was conducted for each SARS-CoV-2 VOC vs mock-infected controls at 6, 12, and 24 h post-infection. Normalized enrichment scores (NES) for enriched pathways (false discovery rate (FDR) < 0.25) in two or more comparisons are shown. Cells where FDR > 0.25 are masked in gray. Statistical analysis was conducted using PERMANOVA (a–c). P-values < 0.05 are shown.
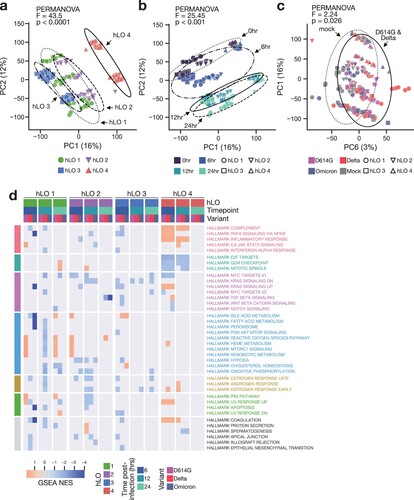
Figure 5. Expression of SARS-CoV-2 entry factors in hLOs. Normalized counts in mock-infected samples of ACE2 (a), TMPRSS2 (b), cathepsin B (c), and cathepsin L (d) are shown. Shading of points indicates time post-mock infection. Error bars denote grand mean +/ SEM of n = 12 replicates per hLO donor. Statistical analysis was conducted using Wald test with Benjamini-Hochberg adjustment for multiple test correction, as implemented in DESeq2. P-values < 0.05 are shown.
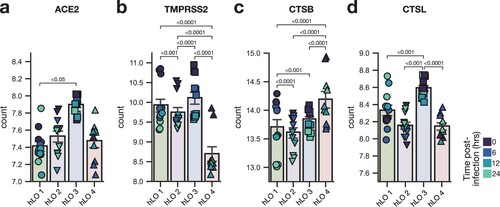
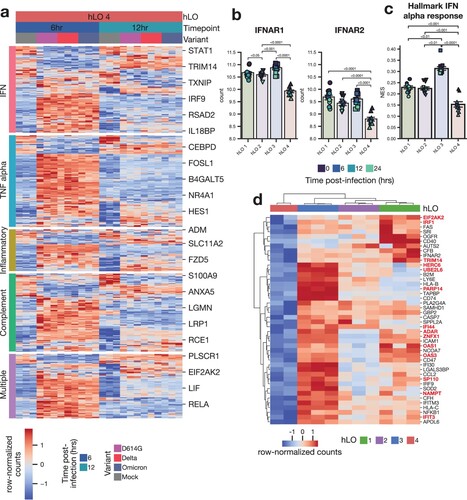
Figure 6. Tonic IFN signaling is reduced in hLO 4. (a) Differentially expressed genes (adjusted p-value < 0.1) in response to infection in hLO 4 were analyzed for their membership in the indicated MSigDB hallmark pro-inflammatory signaling pathways. Samples from 6 and 12 h post-infection are shown. (b) Normalized counts in mock-infected samples of IFNAR1 or IFNAR2 are shown. (c) ssGSEA normalized enrichment score (NES) for MSigDB Hallmark IFN alpha response pathway is shown in mock-infected samples. Shading of points indicates time post-mock infection. Error bars denote grand mean +/− SEM of n = 12 replicates per donor hLO. (d) Differentially expressed genes (adjusted p-value < 0.1) related to IFN response (MSigDB Hallmark IFN alpha response, Hallmark IFN gamma response) are shown comparing hLO 4 to other donors in the absence of infection. Genes involved in tonic IFN signaling are highlighted in red.
data_file_S1_expected_counts
Download Zip (18.9 MB)Flagg_et_al_SARS2_VOC_in_hLOs_supplemental_revised_clean_version
Download MS Word (3.2 MB)Data availability statement
Data included in this manuscript have been deposited in Figshare at https://doi.org/10.6084/m9.figshare.22266313. Flow cytometry data are available at http://flowrepository.org/id/FR-FCM-Z65R. RNA sequence data sharing is restricted by Informed Consent; gene counts can be found in supplementary data file 1.