
Figures & data
Figure 1. The Cas9-CRY2 protein retained its gene editing function and translocated into the cytoplasm under blue light. (A) Diagram illustrating vectors expressing Cas9-CRY2/sgRNA or MyrPalm-CIBN and their light-induced interaction. (B) HEK293T cells were co-transfected with vectors expressing Cas9-CRY2-eGFP and MyrPalm-CIBN, followed by culturing under blue light or in the dark. After 48 h, the localization of Cas9-CRY2-eGFP was observed using confocal microscopy. (C) Huh7 cells were co-transfected with vectors expressing 1.2×HBV, Cas9-CRY2/gHBV1, and Cas9-CRY2/gHBV2. Additionally, vectors expressing Cas9/gHBV1 and Cas9/gHBV2 were transfected into Huh7 cells as a positive control. After 48 h, DNA was extracted and amplified by PCR using HBV-251-F and HBV-2137C-R primers. The PCR products were detected via agarose gel electrophoresis. (D) Diagram of PCR amplification after dual gRNA cleavage and representative sequence. The smaller PCR products (indicated by the red arrow) were purified and subjected to clone sequencing analysis.
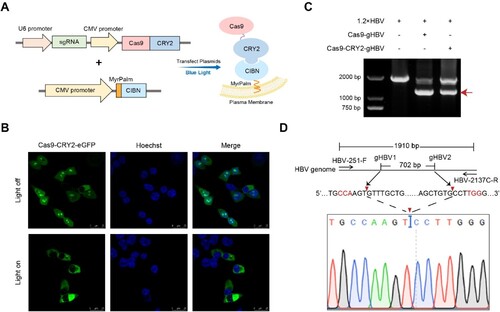
Figure 2. Protein acylation and light-induced interaction promoted encapsulation of Cas9/gRNA into EVs. (A) The vector expressing Cas9/gHBV1 was transfected in HEK293T cells, and EVs were purified from the culture supernatants through differential centrifugation. The morphology and size distribution of EVs-Ctrl-Cas9 were examined using JEM-1400 transmission electron microscopy (TEM) and Nanosight NS300. (B) HEK293T cells were co-transfected with vectors expressing Cas9-CRY2/gHBV1 and MyrPalm-CIBN, and cultured under blue light. The morphological structure and size distribution of EVs-Cas9-CRY2, isolated through differential ultracentrifugation, were analyzed by JEM-1400 TEM and Nanosight NS300. (C) Western blot analysis was performed on HEK293T cells expressing Cas9-CRY2/gHBV1 and MyrPalm-CIBN under blue light, as well as their purified EVs. The expression levels of Cas9-CRY2 and MyrPalm-CIBN in total cell lysates and EVs were examined. β-actin served as a negative protein biomarker for EVs, while CD81 was used as a positive protein biomarker. (D) The presence of gHBV1 in the purified EVs mentioned above was detected using qRT-PCR and further confirmed by Sanger sequencing. GAPDH was utilized as an internal control. Statistical analysis was conducted using Student's t-test with ***p < 0.001.
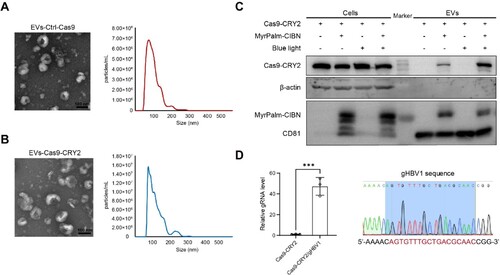
Figure 3. VSV-G enhanced the translocation of Cas9 protein into the nucleus of recipient cells following the uptake of EVs. (A) Experimental schematic for producing EVs containing Cas9-Nluc-CRY2. HEK293T cells were co-transfected with vectors expressing Cas9-Nluc-CRY2 and MyrPalm-CIBN, and cultured under blue light. EVs were purified from the conditioned medium and incubated with Huh7 cells in the dark for 6 h. (B-C) Luciferase activity was measured in EVs derived from HEK293T donor cells and total lysates of Huh7 recipient cells after incubation. RLU: relative luminescence units. Data were statistically analyzed using Student's t-test with *p < 0.05 and ***p < 0.001. (D) HEK293T cells were transiently co-transfected with vectors expressing Cas9-CRY2-eGFP and MyrPalm-CIBN, and cultured under blue light. EVs were purified and incubated with Huh7 cells in the dark for 24 h. The subcellular localization of Cas9-CRY2-eGFP in Huh7 recipient cells was observed under confocal microscopy. (E) Vectors expressing Cas9-CRY2/gHBV1, MyrPalm-CIBN, and VSV-G were co-transfected into HEK293T cells. After culturing the cells under blue light, EVs were isolated using differential centrifugation. The morphology and size distribution of EVs-Cas9-CRY2 + VSV-G were analyzed using JEM-1400 TEM and Nanosight NS300. (F) HEK293T cells were co-transfected with vectors expressing Cas9-CRY2-eGFP, MyrPalm-CIBN, and VSV-G and cultured under blue light. EVs containing Cas9-CRY2-eGFP and VSV-G were purified and incubated with Huh7 cells in the dark. The subcellular localization of Cas9-CRY2-eGFP in Huh7 recipient cells was observed under confocal microscopy at 6, 12, and 24 h post-treatment with EVs.
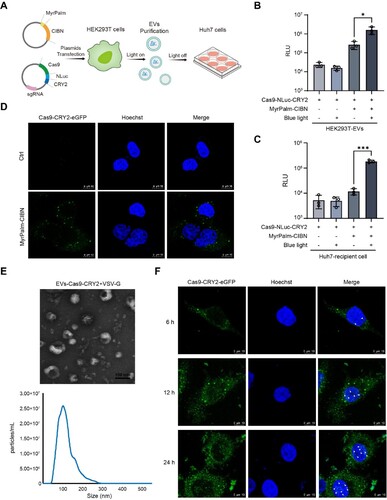
Figure 4. Antiviral effects of VSV-G coated EVs containing Cas9/gRNA RNP in the HBV-replicating cell model. (A) Experimental schematic for producing VSV-G packaged EVs containing Cas9/gHBV. Huh7 cells were transfected with a 1.2×HBV expression vector to construct the HBV-replicating cell model. Vectors expressing Cas9-CRY2/gHBV1, Cas9-CRY2/gHBV2, MyrPalm-CIBN, and VSV-G were transiently co-transfected into HEK293T cells. After culturing under blue light, EVs containing Cas9/gHBV and VSV-G were isolated from the conditioned medium and incubated with Huh7 cells in the dark for 48 h. (B-C) The levels of HBeAg and HBsAg in the supernatants of Huh7 cells after incubation with EVs were quantified using chemiluminescence immunoassay (CLIA). (D) HBV DNA was extracted from the culture supernatants of Huh7 cells, which had been treated with DNase I to remove cell-free DNA, and quantified using quantitative polymerase chain reaction (qPCR). Data from each group were statistically analyzed by Student’s t-test with *p < 0.05, **p < 0.01, ***p < 0.001, and ****p < 0.0001. (E) Total DNA from Huh7 cells incubated with EVs was extracted and amplified using PCR with HBV-251-F and HBV-2137C-R primers. (F) The smaller PCR products (indicated by the red arrow) were purified and subjected to clone sequencing analysis.
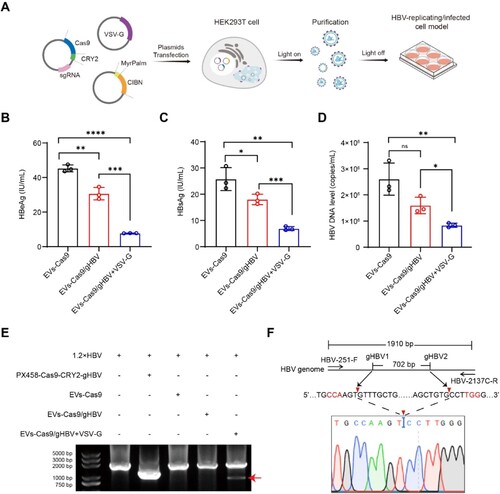
Figure 5. Antiviral effects of engineered EVs in the HBV-infected cell model. (A-C) HepG2-NTCP cells were infected with HBV and then incubated with EVs containing VSV-G and Cas9/gHBV. Subsequently, culture supernatants were collected to measure the levels of HBeAg, HBsAg, and HBV DNA using CLIA and qPCR. (D) Total DNA was extracted from HepG2-NTCP cell lysates post EVs incubation, and the relative level of cccDNA was quantified by qPCR. Data from each group were statistically analyzed by Student’s t-test with **p < 0.01, ***p < 0.001, and ****p < 0.0001. (E) The intracellular level of HBcAg in HepG2-NTCP cells was determined through Western blot, with β-actin serving as an internal control. (F) The total DNA of HepG2-NTCP cells incubated with EVs was amplified using PCR with HBV-251-F and HBV-2043D-R primers. (G) The smaller fragments (indicated by the red arrow) were purified and subjected to clone sequencing analysis.
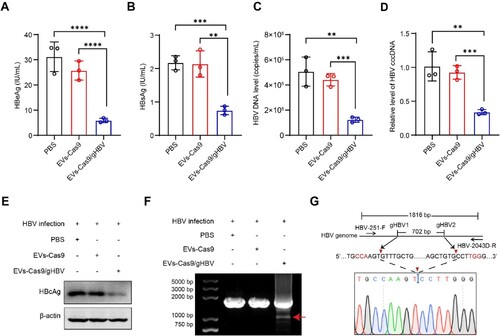
Figure 6. Antiviral effects of engineered EVs in the HBV-replicating mouse model. (A-B) Serum levels of HBeAg and HBsAg were measured by CLIA. Data were statistically analyzed by Student’s t-test with *p < 0.05 and **p < 0.01. (C) Immunohistochemical staining (IHC) was used to detect HBcAg levels in the livers of mice 7 days post-injection. Scale bars: 100 μm. (D) To assess viral genome editing, total DNA was extracted from the liver tissue, and PCR amplification was performed using HBV-251-F and HBV-2137C-R primers. (E) Following dual-gRNA mediated cleavage, the smaller fragments (indicated by the red arrow) were purified and subjected to clone sequencing analysis.
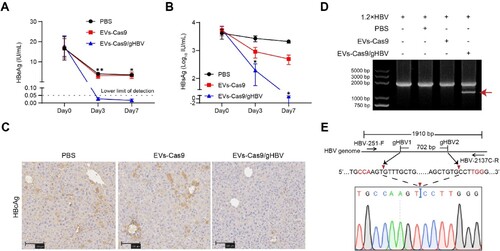
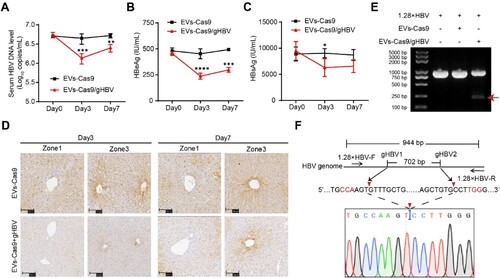
Figure 7. Antiviral effects of engineered EVs in HBV transgenic mice model. (A-C) Serum levels of HBeAg and HBsAg were measured using CLIA. HBV DNA in the sera was detected by qPCR. Data were statistically analyzed by Student’s t-test with *p < 0.05, **p < 0.01, ***p < 0.001, and ****p < 0.0001. (D) Intrahepatic levels of HBcAg in mice were detected by IHC. Zone 1: the portal spaces; Zone 3: the pericentral vein. Scale bars: 100 μm. (E) To detect the gene-editing of integrated viral fragments, total DNA was extracted from the liver of mice 3 days after EVs injection and amplified using PCR with 1.28×HBV-F and 1.28×HBV-R primers. (F) The smaller fragments (indicated by the red arrow) were purified and subjected to clone sequencing analysis.
Supplementary_figures
Download MS Word (1.3 MB)Data availability statement
The data supporting this study’s findings are available from the corresponding author upon reasonable request.