Figures & data
Figure 1. Generation of IFNAR extracellular-humanized mice. (A) Schematic representation of the knock-in strategy for the IFNAR-hEC coding gene. Two knock-in vectors were constructed by inserting cDNA encoding the extracellular domain of human IFNAR fused with the mouse transmembrane and cytoplasmic segments into the respective mouse Ifnar1 and Ifnar2 genomic loci. Arrows indicate PCR primers for genotyping. (B) A representative result of genotyping to confirm the homozygosity of IFNAR-hEC knock-in alleles. Wild-type alleles were regarded as bands at 345/346 bp; Ifnar1 and Ifnar2 knock-in alleles were regarded as bands of 859 and 470 bp, respectively. (C) Representative results of RT-qPCR analysis for the tissue distribution of mouse Ifnar and IFNAR-hEC transcriptional level. Numbers above denote the mouse genotypes: (1) Ifnar+/+, (2) IfnarhEC/+, (3) IfnarhEC/hEC. (D) Flow cytometry analysis for the expression of IFNAR-hEC in Ifnar+/+ (wild-type) and IfnarhEC/hEC (Ho) by human IFNAR1/2 antibodies. (E) Expression levels of hIFNAR-EC on different lymphocyte subsets in IfnarhEC/hEC.
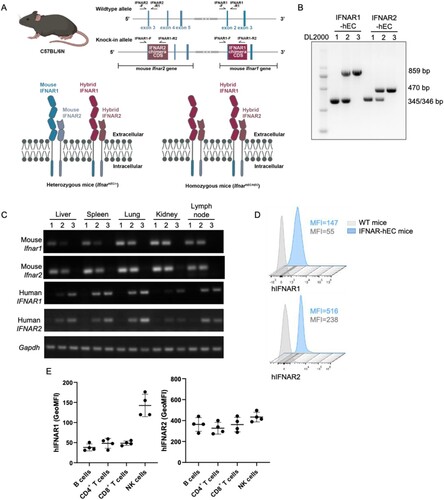
Figure 2. Responses of IFNAR-hEC mice to treatment with human IFN-I. (A, B) Primary mouse hepatocytes isolated and treated with human IFN-α2 or mouse IFN-α1 for 0.5 and 6 h were extracted for analysis of p-STAT1(Y701), p-STAT2(Y690), and expression of ISGs, respectively. (C) IfnarhEC/+ mice were intravenously administered hIFN-α2 for 6 h, then sacrificed. Total RNA from liver samples was used for RT-qPCR analysis of representative ISGs. Statistically significant differences are indicated by * for p < 0.05, ** for p < 0.01 and *** for p < 0.001. Abbreviations: WT, wild-type mouse; HE, heterozygous IFNAR-hEC mouse; HO, homozygous IFNAR-hEC mouse.
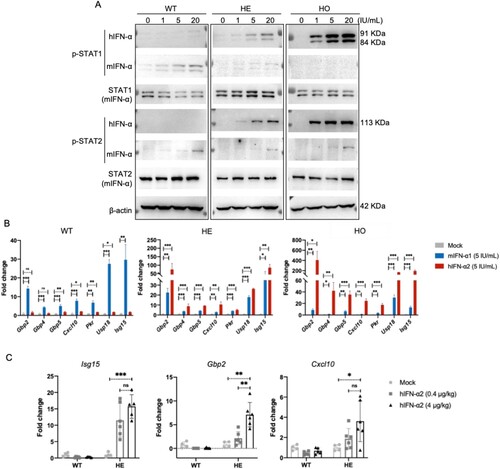
Figure 3. Heterozygous IFNAR-hEC mice possess intact endogenous IFN-I system. (A) Schematic model of the study design. (B) Mouse sera were collected at the indicated time points, and the levels of endogenous mIFN-α were quantified using ELISA. (C) Viral load in the blood was assessed by qPCR for NP RNA at different time points post-infection. (D) Viral load in the spleens was evaluated by qPCR for NP RNA on day 10. Statistically significant differences are indicated by * for p < 0.05, ** for p < 0.01 and *** for p < 0.001. Abbreviations: WT, wild-type mouse; HE, heterozygous IFNAR-hEC mouse; HO, homozygous IFNAR-hEC mouse.
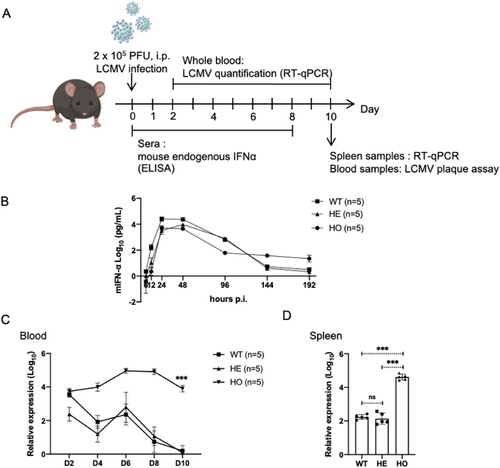
Figure 4. Effects of human IFN-α2 and -α14 subtypes on IFN-α and -γ signalling in IFNAR-hEC mice. (A) Schematic model of IFN-I–activated signalling pathways. (B) Primary mouse hepatocytes isolated and treated with human IFN-α2 or IFN-α14 for 30 min were extracted for analysis of p-STAT1(Y701) and p-STAT2(Y690). (C) Primary mouse hepatocytes were treated with 2 ng/mL IFN-α2 or IFN-α14 for 30 min. The STAT1/STAT2 heterodimers and STAT1 homodimers were examined by native PAGE followed by immunoblotting. (D) mRNA levels of GBPs in primary mouse hepatocytes treated with 2 ng/mL hIFN-α for 6 h were determined by RT-qPCR. (E, F) IFNAR-hEC mice were treated with 3.2 μg/kg of IFN-α2 or IFN-α14 every 2 days for 2 weeks. Liver tissue samples were collected six hours after an additional IFN administration. Total RNA was extracted from liver on day 14 for RNA-seq analysis. The heatmap shows differentially expressed genes between IFN-α14-treated and IFN-α2-treated groups. (G) Gene Ontology analysis of differentially expressed genes, showing the top 14 significantly enriched biological processes. Statistically significant differences are indicated by * for p < 0.05, ** for p < 0.01 and *** for p < 0.001.
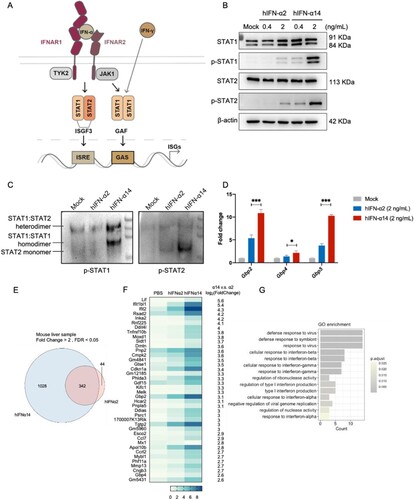
Figure 5. Effect of human IFN-α2 and IFN-α14 on the activation of dendritic cells and T cells in IFNAR-hEC mice. (A, B) Mouse CD3+ T cells enriched and treated with human IFN-α2 or IFN-α14 for 30 min and 6 h were extracted for analysis of p-STAT1(Y701), p-STAT2(Y690), and expression of ISGs, respectively. (C-F) IFNAR-hEC mice were injected with 3.2 μg/kg of IFN-α2 or IFN-α14; after 6 h, splenocytes were isolated and analyzed by flow cytometry for (C) the expression of CD80 and CD86 on dendritic cells, (E) the percentage of CD69+ CD8+ T cells, and (F) the percentage of IFN-γ producing CD8+ T cells. (D) The percentage of activated Ki67+ CD8+ T cells was analyzed after treatment with the indicated human IFN-α for 48 h. Statistically significant differences are indicated by * for p < 0.05, ** for p < 0.01 and *** for p < 0.001.
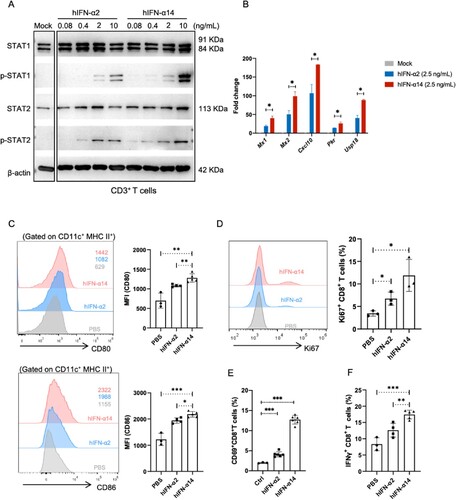
Figure 6. IFN-α14 more effectively promotes cross-priming of CD8+ T cells. (A) IFNAR-hEC mice were immunized by subcutaneous injection with OVA alone or with OVA and human IFN-α; 8 days later, splenocytes were isolated and analyzed for SIINFEKL-specific CD8+ T cells. (B, C) The percentage of SIINFEKL-specific CD8+ T cells was quantified by MHC I tetramer staining and IFN-γ ELISPOT assays. (D) Lymphocytes from wild-type mice were pulsed with OVA257-264 peptide and labelled with CFSE as target cells, then transferred into recipient mice that had been immunized for 7 days. After 24 h, splenocytes from recipient mice were isolated to determine cytotoxic activity in SIINFEKL-specific CTLs. Statistically significant differences are indicated by * for p < 0.05, ** for p < 0.01 and *** for p < 0.001.
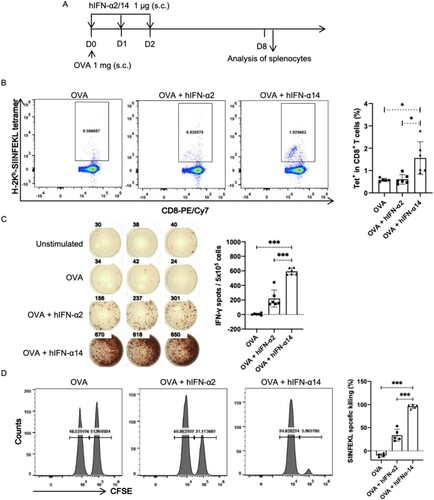
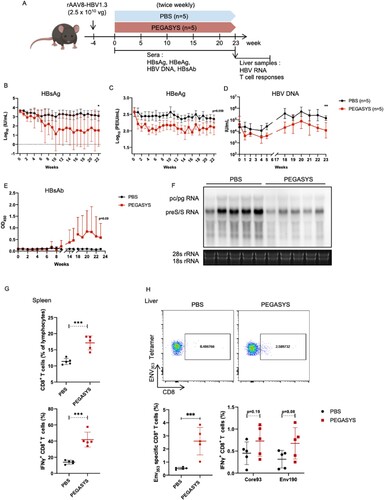
Figure 7. Antiviral and immunomodulatory activities of PEGylated IFN-α2 in IFNAR-hEC mice with HBV replication. An AAV/HBV mouse model was established by intravenous administration of 2.5 × 10¹⁰ copies of recombinant adeno-associated virus serotype 8 carrying the HBV genome (rAAV8-HBV1.3). Mice were grouped according to day 0 serum HBsAg level, then subcutaneously injected with 30 μg/kg PEGASYS or an equal volume of phosphate-buffered saline (PBS), as indicated (A). Blood was collected weekly and tested for (B) HBsAg, (C) HBeAg, (D) HBV DNA and (E) HBsAb. Mice were sacrificed at the administration endpoint; total RNA was extracted from liver samples for detection of HBV RNA via Northern blotting (F). Splenocytes were isolated and analyzed for the frequency and production of IFN-γ of total CD8+ T cells (G). An ENV353-specific subset of lymphocytes in liver was labelled by the anti-CD8 antibody and ENV353 tetramer, and was analyzed by flow cytometry. The responsiveness of specific intrahepatic T cell to Core93 or Env190 were tested with an intracellular staining assay for IFN-γ (H). Statistically significant differences are indicated by * for p < 0.05, ** for p < 0.01 and *** for p < 0.001.