
Figures & data
Figure 1. Production and characterization of H5N1 VLP. The expression of the HA and M1 proteins was observed in the infected sf9 cells using IFA. Sf9 cells infected with rBV-HA (A), rBV-M1 (C), or only empty baculoviruses (B), (D) after 48 h. (E) The expression of the HA and M1 proteins on the VLP was analysed using SDS-PAGE gels with coomassie blue staining and validated by western blot using the His-tag mouse monoclonal antibody and H5 subtype HA mouse monoclonal antibody. (F), (G) Negative staining electron microscopy of the H5N1 VLP. Purified VLPs were stained using 1% phosphotungstic acid.
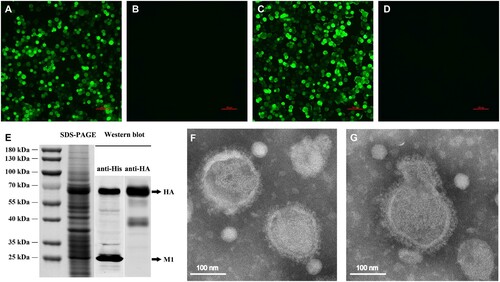
Figure 2. Hemagglutinin inhibition (HI) titres of SPF chickens after immunization and survival rates of chickens after challenge. Chickens were subcutaneously immunized with 40 μg of H5N1 VLP vaccine (adjuvanted with ISA 201 or ISA 71) or commercial vaccine. (A, C) The serum samples from each group of vaccinated chickens were collected at 3 weeks post-vaccination, HI titres against H5N1-SD57 virus. The HI titres among vaccination groups were compared using an unpaired t-test. Statistically significant differences are indicated by **p < 0.01. (B, D) At 3 weeks post-vaccination, groups of chickens were intranasally challenged with 106.0 EID50 of the homologous H5N1-SD57 virus. Survival rates of chickens were measured daily for 14 days after challenge. PBS group (n = 5), vaccine group (n = 10).
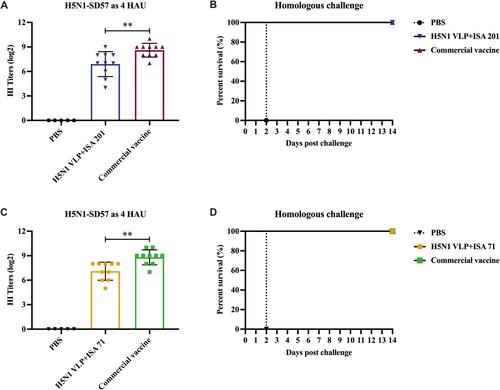
Figure 3. Cytokine expression levels in PBMCs of SPF chickens (n = 3). The mRNA expression levels of IFN-γ, IL-4, and IL-17 after virus stimulation (A, B, C) or antigen stimulation (D, E, F) were determined using qRT-PCR. The cytokine levels among groups were compared using one-way ANOVA followed by Tukey’s multiple comparison test. Data represented mean ± SD. Statistical significance of differences is illustrated as follows: *p < 0.05, **p < 0.01.
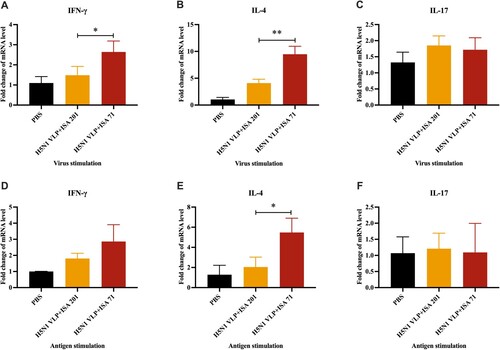
Figure 4. Immunogenicity and protection against HPAI H5N1-D889 virus. (A) Animal experimental 2 design for immunization and challenge. The serum samples from each group of vaccinated chickens were collected at 3 weeks post-vaccination. (B) HI titres against H5N1-SD57 virus. (C) HI titres against H5N1-D889 virus. Neutralizing antibodies from each group (n = 4) were measured by neutralization assay, (D) Neutralizing antibodies titres against 100 TCID50 of H5N1-SD57 virus. (E) Neutralizing antibodies titres against 100 TCID50 of H5N1-D889 virus. (F) Groups of chickens were intranasally challenged with 106.0 EID50 of the antigenically divergent H5N1-D889 virus. Survival rates of the chickens after challenge. PBS group (n = 5), vaccine group (n = 10). *p < 0.05 by Log-rank (Mantel–Cox) test.
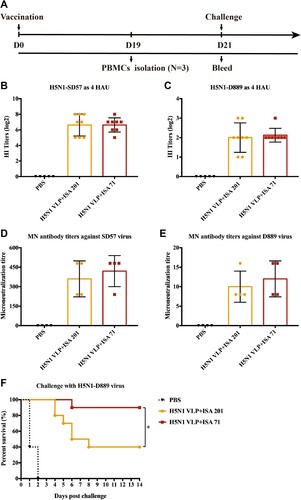
Table 1. Virus shedding after H5N1-D889 virus challenge of chickens.
Figure 5. HI and neutralizing antibody titres of serum from vaccinated chickens. The serum samples from each group of vaccinated chickens were collected at 3 weeks post-vaccination. (A) HI titres against H5N1-SD57 virus. (B) HI titres against H5N1-D889 virus. (C) Neutralizing antibodies from each group (n = 4) were measured by neutralization assay, neutralizing antibodies titres against 100 TCID50 of H5N1-D889 virus. (D) HI titres against H5N1-SD57 virus induced by 40, 60, and 80 μg of adjuvanted H5N1 VLP vaccine. (E) HI titres against H5N1-D889 virus induced by 40, 60, and 80 μg of adjuvanted H5N1 VLP vaccine. (F) Neutralizing antibodies titres against H5N1-D889 virus induced by 40, 60, and 80 μg of adjuvanted H5N1 VLP vaccine. PBS group (n = 5), vaccine group (n = 10). The HI antibody titres among vaccination groups were compared using one-way ANOVA followed by Tukey’s multiple-comparison test. The neutralizing antibody titres among vaccination groups were compared using Mann–Whitney U test. Statistically significant differences are indicated by *p < 0.05, **p < 0.01, or ****p < 0.0001.
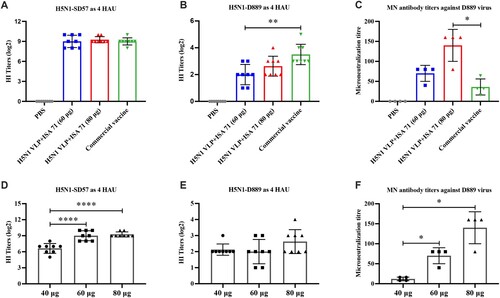
Figure 6. Survival rates of the chickens after lethal H5N1-D889 virus challenge. At 3 weeks after immunization, groups of immunized chickens were intranasally challenged with a high lethal dose (106.0 EID50) of H5N1-D889 virus. Survival rates of chicken were measured daily for 14 days after challenge. PBS group (n = 5), vaccine group (n = 10).
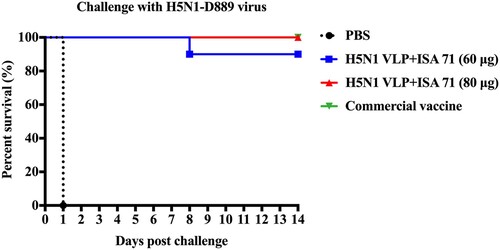
Table 2. Virus shedding of chickens challenged with H5N1-D889 virus.