Figures & data
Figure 1. Map showing the localities where LASV rodent-derived sequences were generated in Guinea, Mali and Sierra Leone. Red dots: sequences provided in this study, green dots: sequences already published (Tables S2–S4).
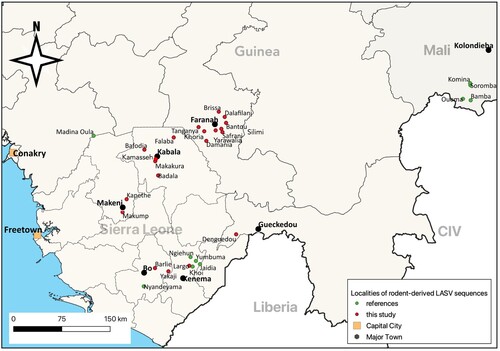
Figure 2. Time-calibrated phylogeny of LASV glycoprotein + nucleoprotein and polymerase sequences within lineages IV and V. Lineage V in Mali was used to root the tree. The analysis included 151 GP + NP sequences and 125 polymerase sequences. Sequences derived from new hosts are indicated in colour (Lophuromys sikapusi in pink and Mastomys erythroleucus in orange). Branches corresponding to clusters in Kenema in Sierra Leone, Kissidougou, Macenta, Faranah in Guinea, Liberia and Mali are collapsed (see Figures S1–S2 for details).
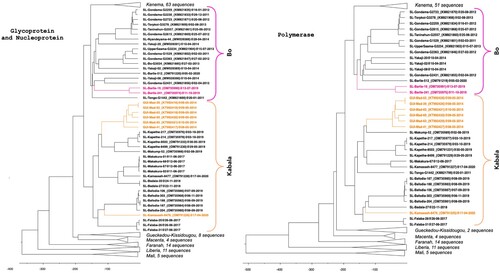
Table 1. TMRCA values and 95% HPD intervals of the S and and L segments in LASV genomes according to country and locality. Values are in years.
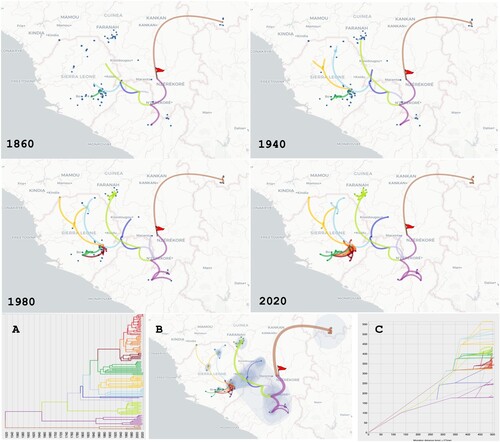
Figure 3. Phylogeographic scenario of LASV spread in Guinea, Liberia, Mali and Sierra Leone based on analysis of the S segment (GP and NP genes, 3186 nt). Upper four panels: Maps showing transition paths of LASV spread from 1880 to 2020, with the transition paths symbolised by curved lines coloured according to their cluster in A. The origin is marked by a red flag. A: Phylogenetic tree with branches in clusters coloured according to the transition paths. B: Map showing the global scenario with 80% of the highest posterior density (coloured blue). Transition paths are of varying thickness, with older paths represented by thick lines and newer paths by thin lines. C: Migration diagram showing distance in km on the x axis and time in years on the y axis. Migration routes are coloured according to the clusters in A.
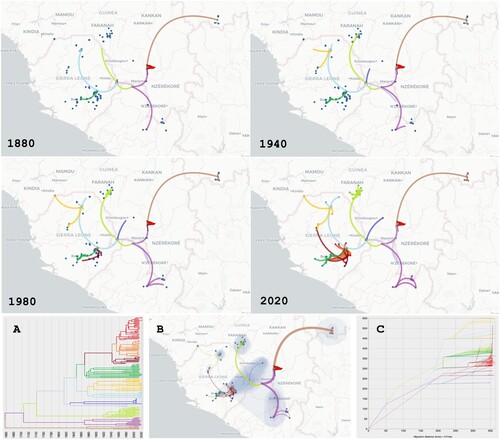
Figure 4. Phylogeographic scenario of LASV spread in Guinea, Liberia, Mali and Sierra Leone based on analysis of the polymerase (L segment, 6678 nt). See for details.