
Figures & data
Figure 1. Schematic diagram of the antibodyomics pipeline. This pipeline is based on the combination of high-throughput immunoglobulin heavy chain (IgH) repertoire sequencing, structural and bioinformatics analysis. Firstly, the published spike-specific mAbs were collected, which of them have determined structures were used for epitope classification. Secondly, PBMC from COVID-19 convalescents and healthy controls were used for IgH repertoire sequencing. Then the sequenced IgH sequences were clustered with the published spike-specific mAbs to identify spike-specific antibody lineages. Lastly, the identified spike-specific antibody lineages were used for downstream analysis, including identification of shared antibody lineages, epitope mapping, persistent or cross-reactive antibody lineage tracking.
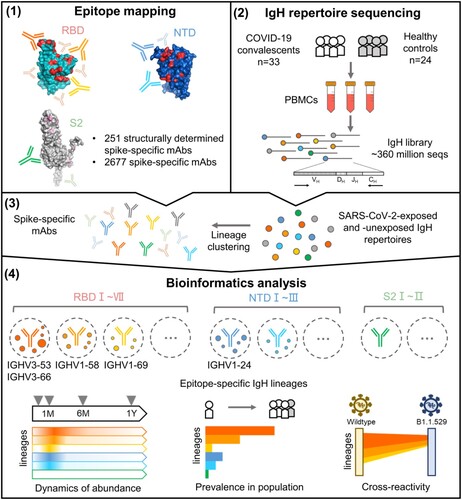
Figure 2. Epitope mapping of SARS-CoV-2 RBD antibodies. (A) UMAP and unsupervised clustering of 221 RBD-targeting mAbs. Seven epitope groups were identified (left). Pie charts show the epitope distribution of mAbs encoded by different IGHVs (right). (B) IGHV germline gene usage was projected onto UMAP (left). Pie charts show the IGHV usage distribution of different classes of mAbs (right). (C) Heatmap shows epitope residues of ACE2 and 7 classes of RBD epitopes. The heatmap is divided into 4 blocks by row. The first block shows the epitope residues of ACE2 and the percentage of each class of mAbs that have interacted with each epitope residue on the RBD. The second block shows the buried surface area (BSA) of ACE2 and the average BSA of each class of mAbs at each epitope residue on the RBD. The third block summarizes the per-site sequence entropy of the RBD. The bottom block shows the substitution sites in the RBD region. (D) Footprints of ACE2 and 7 classes of epitopes on RBD. RBD surface presentation is shown as different orientations. Epitope residues are colored based on the percentage of mAbs that have interacted with these sites.
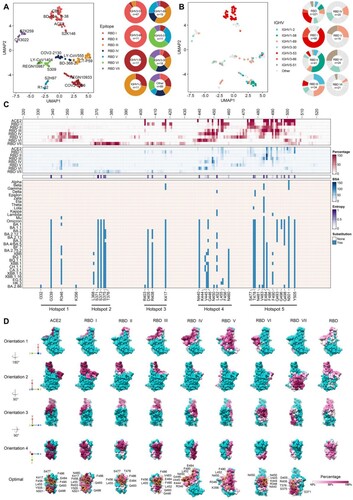
Figure 3. Identification of spike-specific IgH lineages. (A) Heatmap shows the 625 spike-specific IgH lineages. The heatmap is divided into 4 parts by row according to the different spike domains. The top annotation represents grouping information (Visit 1 to Visit 4). Left annotation represents IGHV usage of the spike-specific IgH lineages. Right annotation represents the prevalence of each lineage. The most prevalent lineages are marked with their related mAbs. (B) Venn diagram shows the number of overlapped spike-specific IgH lineages between SARS-CoV-2-exposed and -unexposed individuals. (C) Comparison of antibody isotype distribution of the spike-specific IgH lineages in SARS-CoV-2-exposed and -unexposed individuals. A two-tailed chi-square test was performed (*** p < 0.001). (D) Comparison of somatic hypermutation (SHM) of the spike-specific IgH lineages in different antibody isotypes in SARS-CoV-2-exposed and -unexposed individuals. SHM of the known spike-specific mAbs is also shown. The Wilcoxon rank-sum test was performed (** p < 0.01, *** p < 0.001).
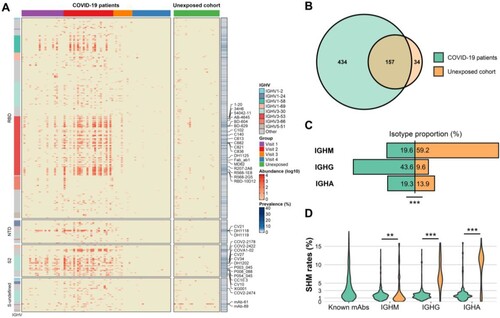
Figure 4. Identification of shared spike-specific clonotypes. (A) Population prevalence and IGHV usage of the 329 shared clonotypes. The size of the dot indicates the number of clonotypes. 11 representative clonotypes are marked. (B) Distribution of shared clonotypes that target different spike domains. The bars are partitioned and colored based on the prevalence of each clonotype. (C) Circos plots and logo plots show the clonal relationship of the top 8 highly shared clonotypes. Interconnecting links within circos plots indicate the relationship between IgH sequences that share IGHV and IGHJ genes and have identical HCDR3 aa sequences. Green links represent clonally related IgH sequences shared by two SARS-CoV-2-exposed individuals, and orange links represent clonally related IgH sequences shared by SARS-CoV-2-exposed and -unexposed individuals. The width of the link is determined by the number of unique IgH sequences shared by two individuals. (D) Logo plots show HCDR3 sequences of each clonotypes. Representative published mAbs clonally related to the clonotypes are listed below the logo plots.
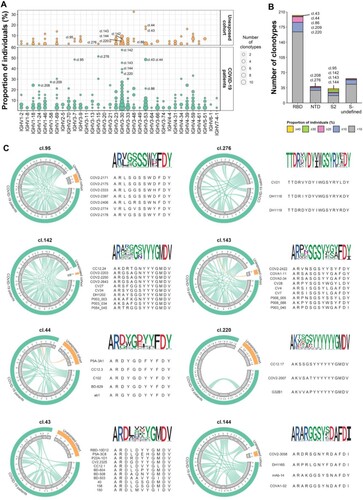
Figure 5. Abundance and prevalence of the epitope-specific antibody lineages. (A) Heatmap shows the abundance and population prevalence of 251 epitope-defined mAbs and their 160 clonally related published spike-specific mAbs. Representative clonotypes are marked with their related mAbs on the right. (B) Abundance of mAbs approved for emergency use authorization or in clinical trials in SARS-CoV-2-exposed (green) and -unexposed (orange) individuals. (C) Abundance of ACE2-competitive (blue) or non-ACE2-competitive (dark blue) spike-specific IgH lineages in each sample of SARS-CoV-2-exposed and -unexposed individuals. Pie charts on the top panel show the prevalence of ACE2-competitive or non-ACE2-competitive spike-specific IgH lineages in SARS-CoV-2-exposed and -unexposed individuals. (D) Abundance of spike-specific IgH lineages that cross-reactive with SARS-CoV-1 (orange) or not (red) in each sample of SARS-CoV-2-exposed and -unexposed individuals. Pie charts on the top panel show the prevalence of spike-specific IgH lineages that cross-reactive with SARS-CoV-1 in SARS-CoV-2-exposed and -unexposed individuals. The one-sided chi-square test was performed in panels (C) and (D) (*** p < 0.001, * p < 0.5, ns p ≥ 0.5).
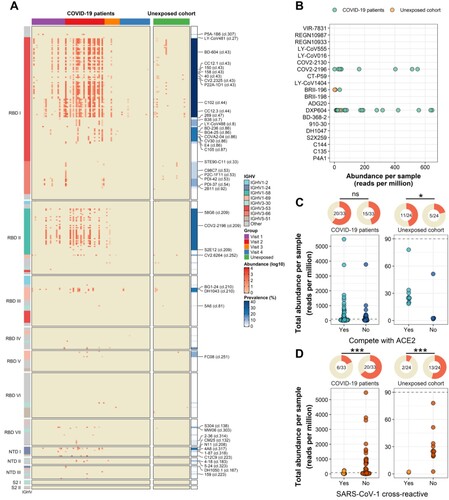
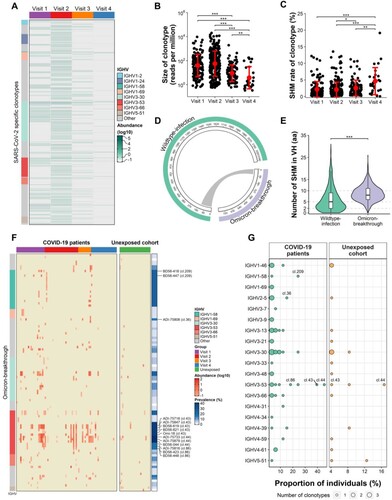
Figure 6. Long-term B-cell memory post ancestral SARS-CoV-2 infection and their clonal relationship with breakthrough infection-induced spike-specific mAbs. (A) Abundance of spike-specific clonotypes in COVID-19 patients at different time points. (B) Dynamics of the clonal size of spike-specific clonotypes one year after SARS-CoV-2 infection. (C) Dynamics of SHM levels of the spike-specific clonotypes one year after SARS-CoV-2 infection. (D) Circos plot shows clonal relationship of spike-specific mAbs induced by wild-type SARS-CoV-2 infections and Omicron breakthrough infections. The width of the link is determined by the number of mAbs shared between two groups. (E) Comparison of heavy chain V domain (VH) SHM levels between mAbs isolated from wild-type SARS-CoV-2 infected and Omicron breakthrough-infected donors (F) Heatmap shows the 98 spike-specific IgH lineages that clonally related to the mAbs isolated from Omicron breakthrough-infected donors. (G) Population prevalence and IGHV usage of the 58 shared clonotypes that clonally related to mAbs isolated from Omicron breakthrough-infected donors. The Wilcoxon rank-sum test was performed in panels (B), (C) and (E) (* p < 0.05; ** p < 0.01; *** p < 0.001).
Clean_Version_Supplementary_Figure_AR_EMI_Revised_202311103.doc
Download MS Word (23.1 MB)Data availability
The data that support this study are available from the corresponding authors upon reasonable request. Raw IgH sequences generated in this study have been deposited at the National Genomics Data Center (https://bigd.big.ac.cn/) under accession number PRJCA003775.