
Figures & data
Figure 1. Sampling sites in Yunnan Province and viral metagenomics. Locations where rodents were trapped are shown in in yellow dots (a). The number of organ samples collected according to rodent species and location (b). Mengyuan Paradise hosts the croplands where rodent trapping took place. Average number of suspected viral contigs and N50 scores for each organ across rodent species (c). XTBG, Xishuangbanna Tropical Botanical Garden.
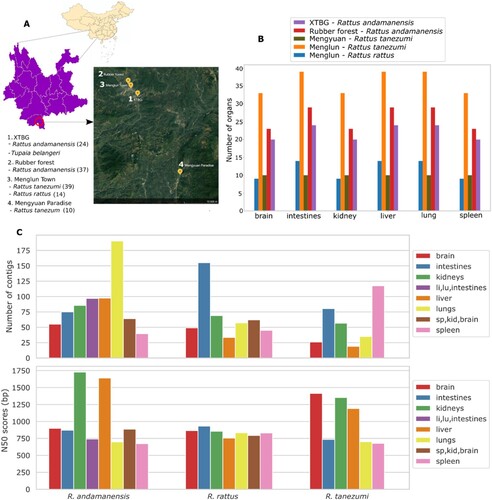
Figure 2. Abundance of selected rodent-associated viral contigs in this study. Sum of viral operation taxonomic units for each indicated viral family (a). Viral read abundance following mapping onto SPAdes (orange) and MEGAHIT contigs (blue) (b). Cooccurrence of indicated viral families across the whole dataset (c). The dark red cells in the heatmap represent strong positive correlations between viral families, indicating that these families tend to co-occur together frequently in the dataset. Hierarchical relationships between rodent organs based on the indicated viral family abundance patterns.
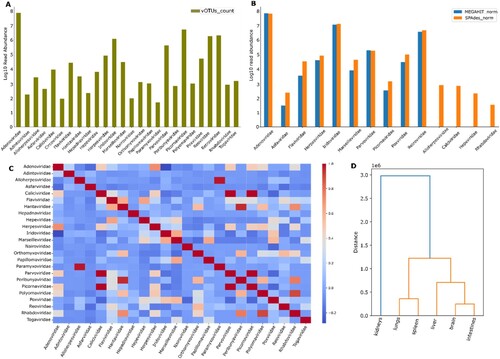
Figure 3. Viral read abundance according to organ, species, and location. Menglun (a); Mengyuan Paradise (b); Rubber plantations (c); Xishuangbanna Tropical Botanical Garden (d). For each location, the first heatmap (on the left side) shows normalized reads from mapped reads to SPAdes contigs, and the second heatmap displays normalized reads from mapped reads to MEGAHIT contigs. The white spaces in (a) & (d) refer to missing organs for the corresponding animal species.
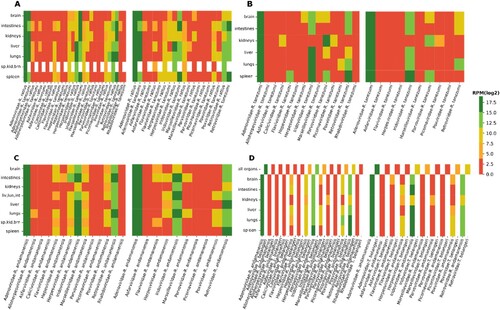
Figure 4. Overall mammal viral diversity in each rodent species across locations with varying influence of human activities and habitat disturbance (a). Mammal viral diversity of each rodent species at the organ level (b).
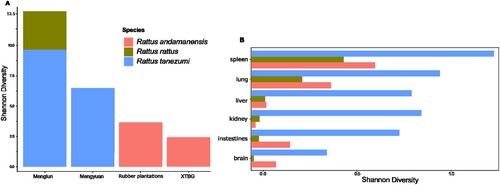
Table 1. Pairwise amino acid identities in NS1 and VP1-VP2 between parvoviruses identified in this study (in italics) and indicative parvoviruses.
Figure 5. Maximum likelihood phylogenetic trees of the whole genome (a), NS1 protein (b), and VP1/VP2 (c & d) protein of representative members of the subfamily Parvovirinae. The blue and green colours highlight the genera Bocaparvovirus and Protoparvovirus, respectively. The rodent protoparvovirus (BRPV1, OQ878961) and the procine bocavirus (BPBoV1, OQ878962) identified in this study are shown in orange. The trees were inferred with IQ-TREE multicore version 2.0.3 with GTR + F + R6 (complete genome), LG + F + I + G4 (NS1, BRPV1), Q.pfam + F + I + G4 (VP1, BRPV1), and LG + F + I + G4 (VP1/VP2, BPBoV1) substitution models following alignment with MAFFT version 7 [Citation23, Citation32]. The phylogenetic tree was supported by Ultrafast bootstrapping with 1000 replicates. The scale bar represents the number of substitutions per site. BRPV1, Banna rat parvovirus 1, BPBoV1, Banna porcine bocavirus 1.
![Figure 5. Maximum likelihood phylogenetic trees of the whole genome (a), NS1 protein (b), and VP1/VP2 (c & d) protein of representative members of the subfamily Parvovirinae. The blue and green colours highlight the genera Bocaparvovirus and Protoparvovirus, respectively. The rodent protoparvovirus (BRPV1, OQ878961) and the procine bocavirus (BPBoV1, OQ878962) identified in this study are shown in orange. The trees were inferred with IQ-TREE multicore version 2.0.3 with GTR + F + R6 (complete genome), LG + F + I + G4 (NS1, BRPV1), Q.pfam + F + I + G4 (VP1, BRPV1), and LG + F + I + G4 (VP1/VP2, BPBoV1) substitution models following alignment with MAFFT version 7 [Citation23, Citation32]. The phylogenetic tree was supported by Ultrafast bootstrapping with 1000 replicates. The scale bar represents the number of substitutions per site. BRPV1, Banna rat parvovirus 1, BPBoV1, Banna porcine bocavirus 1.](/cms/asset/79ff2154-85a9-4df6-b0e6-2f5b2e955a4f/temi_a_2290842_f0005_oc.jpg)
Figure 6. Maximum likelihood phylogenetic tree for a partial nonstructural polyprotein of the family Calciviridae (a) and Picornaviridae (b). The viruses identified in this study are shown in orange/red. The tree was inferred with IQ-TREE multicore version 2.0.3, using the Q.pfam + I + G4 (RNA) and Q.pfam + F + R3 (Banna rat cardiovirus 1) substitution model following alignment with MAFFT version 7 [Citation23,Citation32]. The phylogenetic tree was supported by Ultrafast bootstrapping with 1000 replicates.
![Figure 6. Maximum likelihood phylogenetic tree for a partial nonstructural polyprotein of the family Calciviridae (a) and Picornaviridae (b). The viruses identified in this study are shown in orange/red. The tree was inferred with IQ-TREE multicore version 2.0.3, using the Q.pfam + I + G4 (RNA) and Q.pfam + F + R3 (Banna rat cardiovirus 1) substitution model following alignment with MAFFT version 7 [Citation23,Citation32]. The phylogenetic tree was supported by Ultrafast bootstrapping with 1000 replicates.](/cms/asset/501e071a-78c9-4b45-a529-185086a93ba9/temi_a_2290842_f0006_oc.jpg)
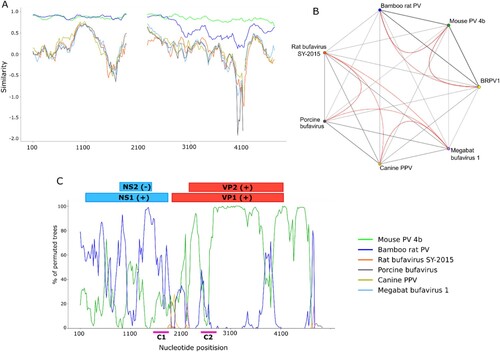
Figure 7. Sequence similarity network and recombination analysis of BRPV1. The Simplot results display the variations between BRPV1 and the generated consensus sequence, and similarity network shows the global (grey lines) and local (red lines) similarities between BRPV1 and the indicated parvoviruses (a and b). Bootccanning shows the magnitude of clusters between BRPV1 and other parvoviruses (c). The percentage of permuted trees in the ordinate supports the clustering according to each sliding window. C1 and C2 display nucleotide positions where supported recombination breakpoints in the genome of BRPV1 were noted.
Supplementary_Method_1
Download MS Word (21.2 KB)supplementary_figure1
Download PDF (444.1 KB)Supplementary_Tables
Download Zip (105.6 KB)Data availability statement
Sequencing data generated during study was submitted to China National Microbiology Data Center under the BioProject NMDC10018463. For each biological sample, the accession number as well as the corresponding link can be found in Supplementary Table 7. Sequences related to the parvoviruses identified in this study were previously submitted to GenBank under the submission numbers: OQ878961- OQ878963.