Figures & data
Figure 1. Heatmap of pairwise ANI values. The dendrogram reflects the degree of identity between genomes.
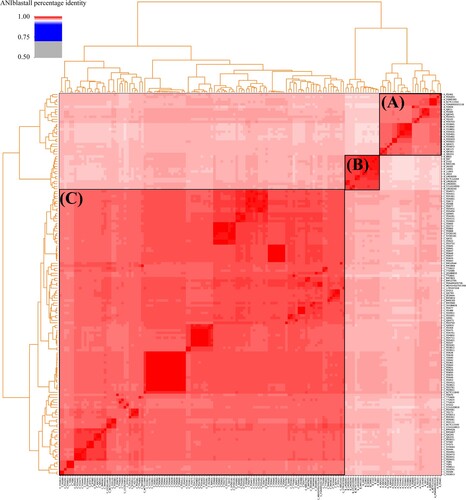
Figure 2. Phylogenomic tree based on core orthologous groups. The first ring represents the strains and clades, the second ring represents the isolated host, the third ring represents the isolated source, the fourth ring represents the isolated location, the fifth ring represents the ST, and the outside ring represents the CC.
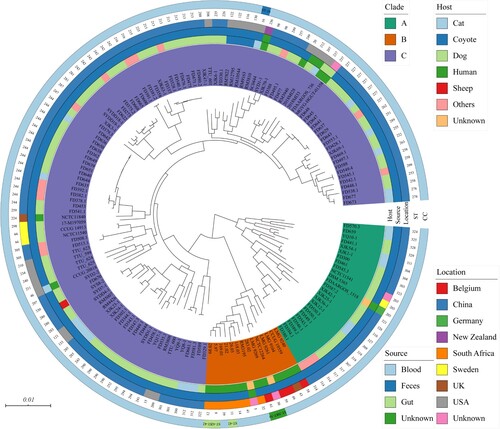
Figure 3. Pangenome analysis of C. upsaliensis genomes. Presence, blue; absence, white. Genomes were ordered based on a phylogenomic tree constructed by the core orthologous groups.
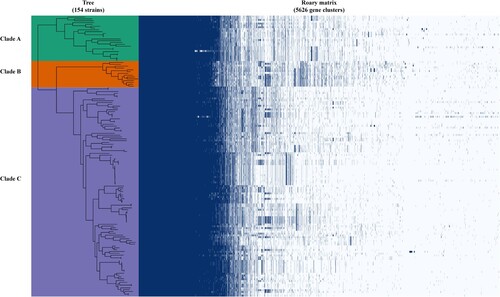
Figure 4. The homologous clusters of C. upsaliensis. (A) Different numbers of core homologous clusters from different clades. (B) COG functional classification of core specific clusters in each clade. The digit indicates the number of clusters.
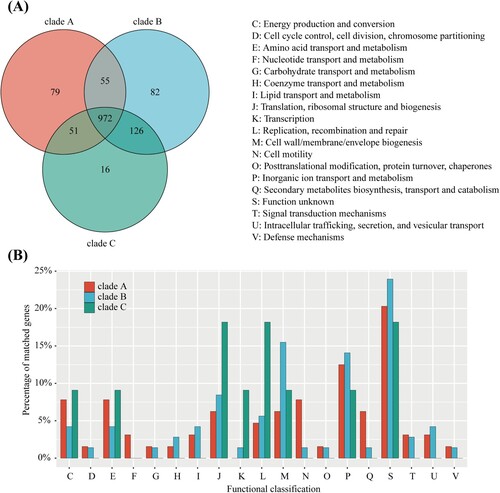
Table 1. MICs of isolated C. upsaliensis in this study to antimicrobials.
Figure 5. Heatmap of the distribution of antibiotic resistance relative genes or mutations. Orange indicates the presence and skyblue indicates the absence.
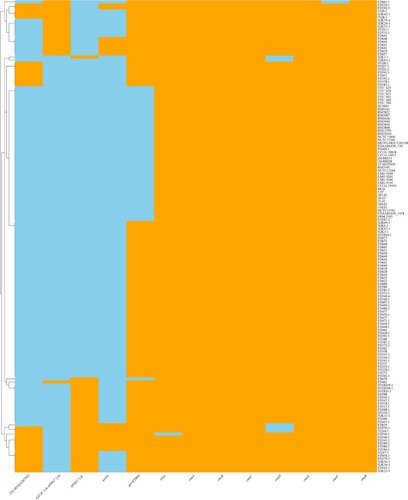
Figure 6. Heatmap of the distribution of virulence genes. Orange indicates the presence, and skyblue indicates the absence.
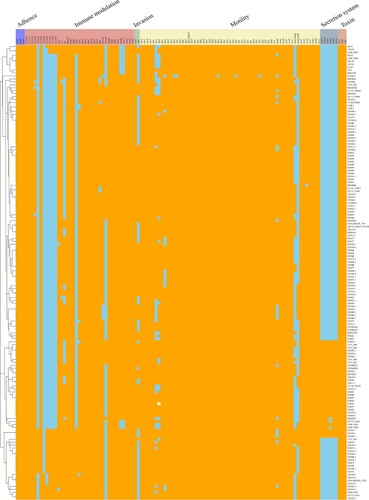
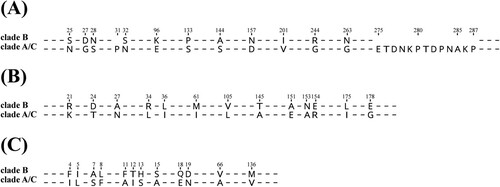
Figure 7. Alignment of amino acids of FlgD, GmhA, and CdtC. (A) FlgD, (B) GmhA, (C) CdtC.