Figures & data
Figure 1. Location and characteristics of the duck farm in Cambodia. (A). Country map. Black lines denote provinces, and the capital Phnom Penh is indicated by a white circulate. Map was generated using QGIS (version 3.28.3). The duck farm from which H14 viruses were isolated is indicated in red. (B, C) Images of the semi free-ranging duck farm. Photographs were taken by Jurre Y. Siegers.
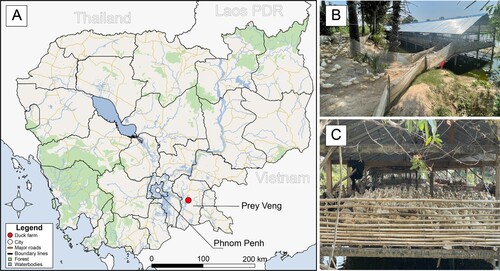
Figure 2. Evolutionary relationships and divergence of HA gene of H14Nx viruses. Phylogeny includes all H14 HA sequences available in public influenza databases (GISAID, NCBI, and BV-BRC) with sequences generated in this study shown in red. Branches are coloured by geographic location. Tree is scaled to time with node bars corresponding to the 95% HPD. HA cleavage site motif is shown for each isolate.
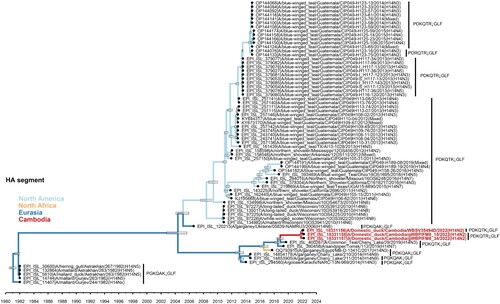
Table 1. Distance matrix of the haemagglutinin gene in percent identities of Cambodia H14N2 viruses versus the genetically closest ancestor.
Figure 3. Phylogenetic relationship of the N2 gene sequences. Maximum Likelihood (ML) tree of Cambodian H14N2 viruses with HxN2 viruses. (A) Tree comprising all sequences in publicly available databases from 2018-2022. Red arrow indicates phylogenetic placement of Cambodian H14N2 in N2 tree for improved clarity. The tree was rooted to reflect geographic clades (B) comprising the >30 most closely related sequences. Sequences generated in this study are presented in red, with strain names emboldened. The tree was rooted against sequences from North America. Ultrafast bootstrap values (≥80) are presented. Scale bar indicates the number of nucleotide substitutions per site.
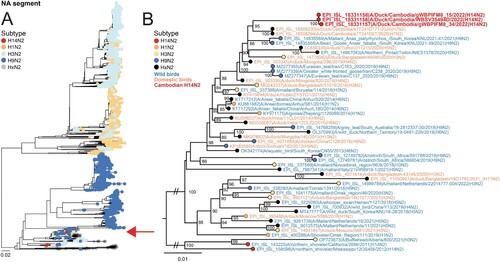
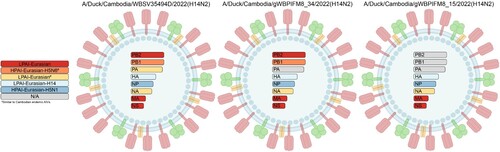
Figure 4. Genome constellation of contemporary Cambodian H14N2 viruses. Genome constellation of each of the Cambodian H14N2 viruses, when available, are colour coded according to their genetic origin.