
Figures & data
Figure 1. Phenotypic characterization of ST11 K. pneumoniae HKU3 and its transconjugants. (a) PFGE profiles of HKU3 and its transconjugants. Asterisk, virulence plasmid; hashtag, blaKPC-2-bearing plasmid. (b) Growth curves of HKU3 and transconjugants in LB broth. (c) In vitro competition in LB broth. (d) In vivo competition in mouse sepsis model. Statistical analysis was conducted by unpaired Student’s t-test. * P < 0.05, ** P < 0.01, ****P < 0.0001. (e) Virulence potential of HKU3 and its transconjugants depicted in a mouse sepsis model. Survival of mice infected with 1.0*107 CFU of each K. pneumoniae was shown (n = 10). Statistical analysis was performed by Log-rank (Mantel-Cox) test. **** P < 0.0001. (f) Serum resistance. Data were presented as mean ± SD of three independent experiments.
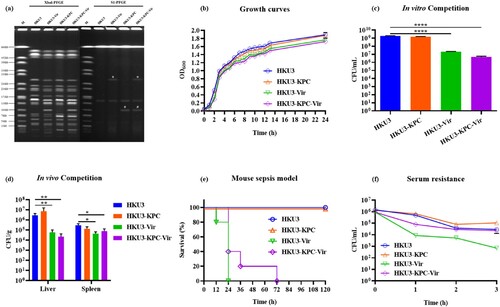
Table 1. Phenotypic and molecular characterization of ST11 K. pneumoniae HKU3 and its transconjugants.
Figure 2. Effect of meropenem and tigecycline on intestinal colonization of K. pneumoniae HKU3 and three transconjugants in rats. (a) Experimental design. SD rats were orally infected with a mixture of HKU3 and three transconjugants and subjected to antibiotic treatments (n = 4). Fresh faeces were collected at indicated days for assessment of K. pneumoniae shedding and further faecal microbiota analysis. The abundance of K. pneumoniae HKU3 (b) and three transconjugants HKU3-KPC (c), HKU3-Vir (d) and HKU3-KPC-Vir (e) colonized in the rat gastrointestinal tract upon different antibiotic treatments was determined during an 18-day experimental period. Data were presented as mean ± standard deviation. DT-D, day during antibiotic treatment; PT-D, day post antibiotic treatment.
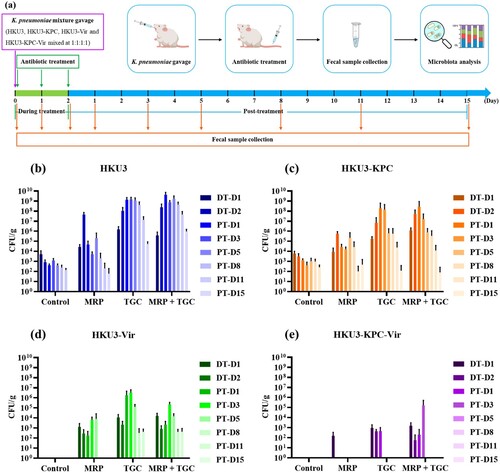
Figure 3. Composition of faecal microbiota. (a) Composition of faecal microbiota at the phylum level. Stacked bar graph showing the relative abundance of dominant organisms (phylum level). The cutoff point for selecting the dominant phyla was set at ≥0.01%. (b) Composition of faecal microbiota at the genus level. Heatmaps depicting the relative abundance of the top 25 bacterial genus detectable. Y axis showed the average percentages of sequence reads. DT-D, day during antibiotic treatment; PT-D, day post antibiotic treatment.
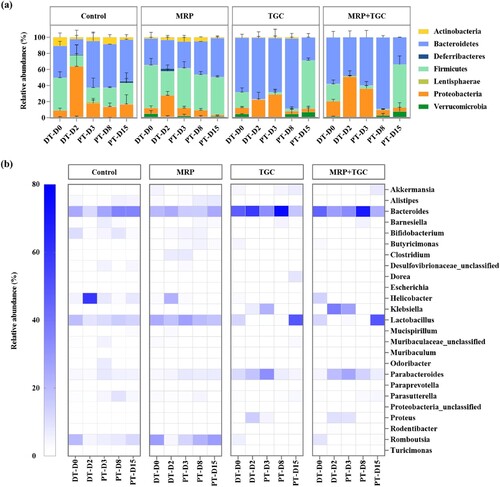
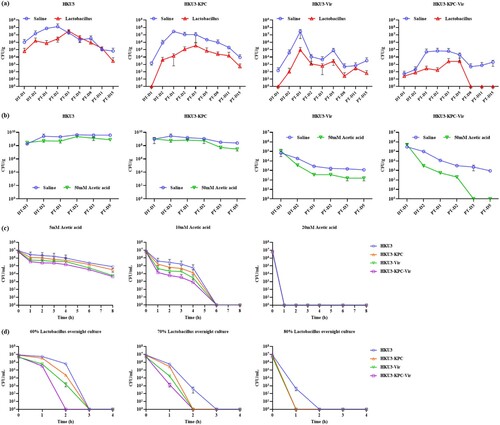
Figure 4. Effect of Lactobacillus spp. and acetic acid on intestinal colonization of K. pneumoniae HKU3 and its transconjugants. Abundance of K. pneumoniae HKU3 and three transconjugants HKU3-KPC, HKU3-Vir and HKU3-KPC-Vir colonized in GI tract upon feeding with Lactobacillus spp. (a) and acetic acid (b). P < 0.0001. DT-D, day during antibiotic treatment; PT-D, day post-antibiotic treatment. Killing curves of K. pneumoniae HKU3 and three transconjugants in acetic acid (c) and Lactobacillus spp. overnight culture (d).
Supplementary_materials
Download MS Word (861.7 KB)Data availability statement
The complete sequence of virulence plasmid p16ZR-26-Vir has been deposited into the GenBank database under the accession number OP168824. Metagenomic sequencing data has been deposited into the NCBI database under the BioProject accession number PRJNA909428.