
Figures & data
Figure 1. Infection rates and MHC-I expression in Calu-3 cells. Cells were mock-treated or infected with different IAV strains. (a) Schematic representation of MHC-I quantification and evaluation of IAV infection rate. (b) Cell surface expression of MHC-I molecules was quantified by staining with pan-HLA-I antibody (W6/32) and analysed by flow cytometry at 24 hpi. (c) Alterations of the MHC-I surface expression were evaluated using QIFIKIT quantitative bead-based assay. Statistical differences were assessed using Brown-Forsythe ANOVA with Dunnett’s T3 multiple comparisons correction (d) Post infection, the cells were permeabilized for intracellular staining of IAV nucleoprotein (NP). The results are representative of two independent experiments (n = 2).
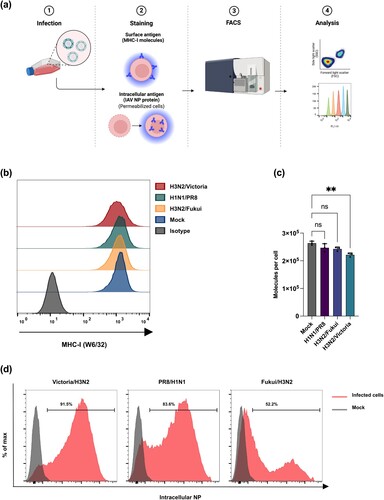
Figure 2. Identification and presentation kinetics of IAV-derived ligands. (a) Schematic representation of epitope mapping workflow. Calu-3 cells were infected with different IAV strains representing both H1N1 and H3N2 subtypes. HLA-peptide complexes were isolated from the cell lysates of infected cells at 3, 6, 9, 12, and 24 hpi by immunoaffinity chromatography with the pan-HLA class I-specific W6/32 antibody coupled to CNBr activated sepharose. HLA-peptide complexes were eluted by acidic elution followed by desalting and concentration steps. The HLA ligands were further analysed by HPLC tandem mass spectrometry (MS/MS). (b-d) The presentation kinetics of HLA-I-bound peptides isolated from infected Calu-3 cells during the infection time course are shown in the upper panel and the area under the curve (AUC) is presented as a percentage of maximum levels detected over the time course (lower panel). Dashed lines indicate the immunodominant epitopes. The MS/MS data were processed using proteome discoverer software V. 1.4, analysed, and visualized using GraphPad prism software ver. 9.3.
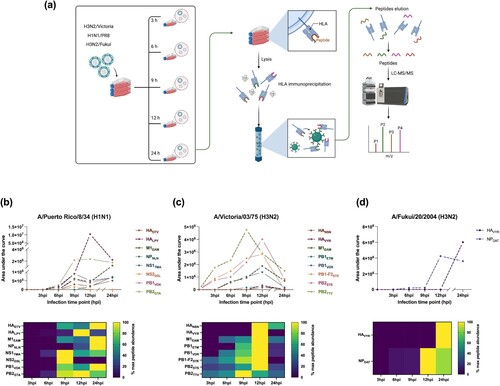
Figure 3. Immunological characterization of naturally presented IAV-derived T cell epitopes by IFN-γ ELISpot assay. Representative ELISpot assays after 12-day in vitro stimulation of PBMCs isolated from HLA-B*51 (a-b), HLA-A*24 (c-d), and HLA-A*68 (e-g) -matched donors. Bars indicate mean spot counts of technical duplicates. The cumulative analysis of screening results was summarized in scatter plots (b), (d), and (g). Each data point represents one single donor tested within one single experiment. Shown are the mean IFN-γ spot forming cells (SFCs) from two technical replicates of each tested donor normalized to the negative control. Irrelevant HLA-matched peptides, either HIV-derived peptides, human self-peptides, or DMSO served as a negative control. Horizontal lines represent the mean values of all tested donors. Positively tested donors are depicted by red circular shapes and negatively tested donors are shown by grey circular shapes. (h) Comparison between IFN-γ SFCs from ELISpot assays in an ex vivo setting and after 12-day stimulation. Four to five donors that showed a high T cell response in the 12-day ELISpot assay for the dominant epitopes NPDAT, HALPY (B*51), and HAVYR (A*24) were retested in the ex vivo system. Paired data points represent one single donor tested within one single experiment. HLA-A*68 restricted dominant epitopes were not included due to sample limitations. HALPY, as HLA-B*07 binder, was also included in the analysis. Shown are the mean IFN-γ SFCs from two technical replicates of each tested donor normalized to the respective negative control. Data points in blue colour represent donors that showed T-cell responses in both experimental settings. Data were analysed and visualized using GraphPad Prism software ver. 9.3.
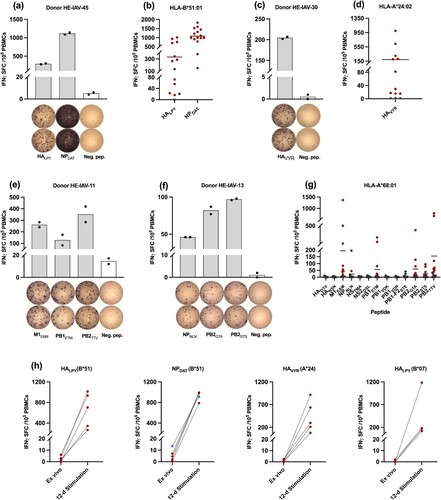
Figure 4. IAV-derived T cell epitopes are multifunctional. (a-d) Representative intracellular IFN-γ, TNF-α, and CD107a staining of PBMCs isolated from healthy HLA-matched donors exhibiting HLA-B*51 (a, b), HLA-A*24 (c), after 12-day stimulation with IAV-derived HLA class I peptides evaluated by flow cytometry. (d) representative tetramer staining after 12-day amplification of CD8+ T cells, derived from HLA-matched donors; HLA-B*51 and HLA-A*24. Irrelevant tetramers were used as a negative control. (e-g) Box and whisker plots represent a cumulative percentage of CD8+ IFN-γ+, CD8+ IFN-γ+ TNF-α+, or CD8+ CD107a+ (h) and the frequency of epitope-specific CD8+ T cells evaluated by tetramer staining. Boxes extend from the 25th to 75th percentiles, whiskers represent minimum to maximum, and the horizontal plotted lines are the median values. The indicated percentages represent the frequency of T-cell responses post stimulation with the test peptide minus the negative control of the respective donor. Each data point represents one single donor tested within one single experiment. Data were analysed and visualized using GraphPad Prism software ver. 9.3 and FlowJo software ver. 10.3. The gating strategies applied for the flow cytometry-based analysis presented in this figure are depicted in the supplements (suppl. Figures 1 and 2).
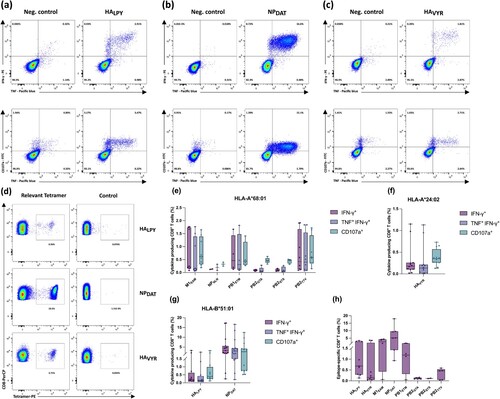
Figure 5. Immunological characterization of naturally presented IAV-derived T cell epitopes by IFN-γ ELISpot assay. Representative ELISpot assay after 12-day in vitro stimulation of PBMCs isolated from HLA-A*01 (a), HLA-A*03 (b), and HLA-B*07 (c) -matched donors. Bars indicate mean spot counts of technical duplicates. The cumulative analysis of screening results was summarized in scatter plots (a-c). Each data point represents one single donor tested within one single experiment. Shown are the mean IFN-γ spot forming cells (SFCs) from two technical replicates of each tested donor normalized to the respective negative control. Horizontal lines represent the mean values of all tested donors. Positively evaluated donors are depicted by red circular shapes and negatively tested donors are shown by grey circular shapes. (d-e) Representative intracellular IFN-γ, TNF-α, and CD107a staining of PBMCs obtained from healthy HLA-matched donors (HLA-B*07), and tetramer staining (f-g) after 12-day amplification of CD8+ T cells derived from HLA-matched donors. Box and whisker plots represent a cumulative percentage of CD8+ IFN-γ+, CD8+ IFN-γ+ TNF-α+ or CD8+ CD107a+ (e) and the frequency of epitope-specific CD8+ T cells evaluated by tetramer staining (g). Boxes extend from the 25th to 75th percentiles, whiskers represent minimum to maximum, and the horizontal plotted lines are the median values. The indicated percentages represent the frequency of T-cell responses post stimulation with the test peptide minus the negative control of the respective donor. Each data point represents one single donor tested within one single experiment. The gating strategies applied for the flow cytometry-based analysis presented in this figure are depicted in the supplements (suppl. Figures 1 and 2).
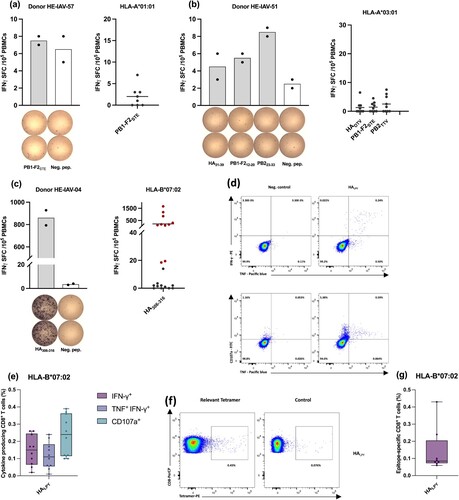
Figure 6. HLA-I epitope conservation analysis in human, swine, and avian zoonotic reservoirs. Bar graphs represent the number of identical sequences (blue), in all available IAV strains sequences (black) in avian (a), swine (b), and human (c). The conservation score (%) is depicted as superimposed red triangles. The distribution of conserved sequences across IAV subtypes is shown in heatmaps for avian (d), swine (e), and human sequences (f). The colour scale represents the conservation index (%), which is indicated as 0% (white colour) to 100% (Dark slate grey colour); the grey colour indicates no sequences were available. Sequences with unknown hemagglutinin (H) or neuraminidase (N) were not included in the heatmaps. Red boxes indicate avian strains associated earlier with potential pandemics. Data were visualized using GraphPad Prism software ver. 9.3.
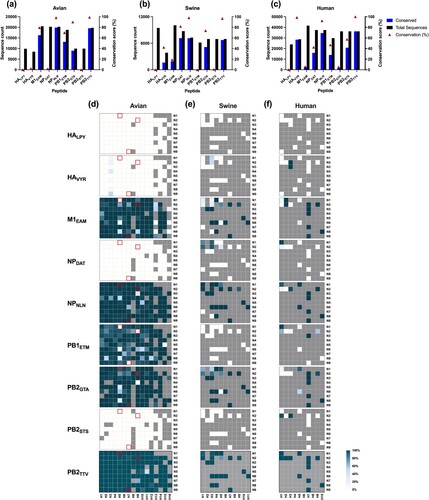
Figure 7. Mapping of the immunogenic T cell epitopes onto IAV proteins. The location of T cell epitopes is mapped on the crystal structure of IAV proteins obtained from the Protein Data Bank (PDB). (a) HALPY (1RU7), (b) HAVYR (6CEX), (c) NPDAT and NPNLN (2IQH), (d) M1EAM (7JM3), PB1ETM (6RR7), and (f) PB2GTA/STS and PB2TTV. Molecular graphics and analyses were performed with UCSF ChimeraX software.
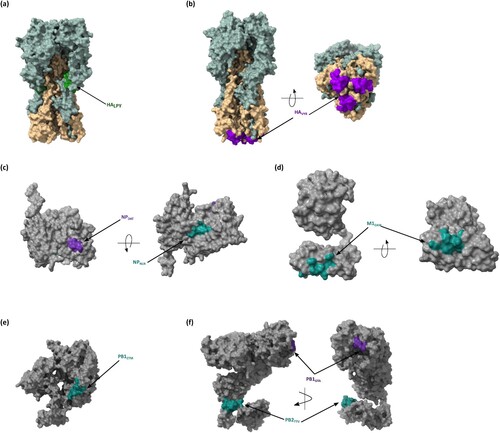
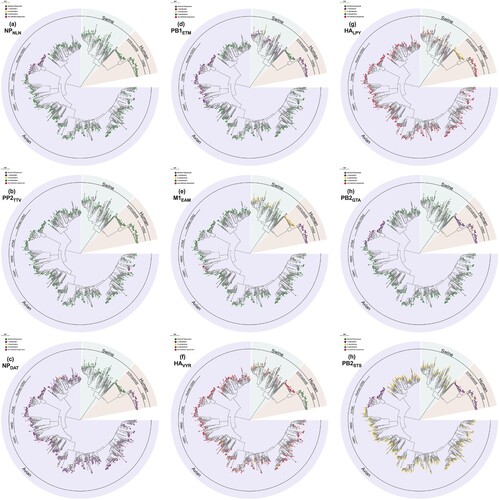
Figure 8. Amino acid substitutions do not affect the peptide anchor residues. Details of the substitutional divergence of all identified epitopes are depicted in the phylogenetic trees (a-i). Sequence homology and amino acid substitution rates were estimated using the influenza research database by applying the point mutation analysis algorithm. The phylogenetic relationship was evaluated with the Neighbor-Joining method. The evolutionary distances were computed using the Jukes-Cantor model, and the variation rate among sites was modelled with a gamma distribution. Epitopes with identical sequences are designated in green; the number of amino acid substitutions is colour-coded, and red colour represents sequences that harbour more than 3 substitutions. Major IAV lineages and strains associated earlier with potential pandemics are indicated.
Supplemntary_information_1
Download MS Word (1.4 MB)Data availability
The MS/MS data have been deposited to the ProteomeXchange consortium repository (http://proteomecentral.proteomexchange.org) via the PRIDE partner repository [Citation35] with the dataset identifier PXD035241.