Figures & data
Figure 1. Whole-genome phylogenetic tree of Histoplasma isolates collected in the United States. The branches are proportional to the number of mutations and 1000 ultrafast bootstraps and SH-aLRT were used supporting the major branches of the tree. The nodes in the tree represent common ancestors, and the branching points indicate the divergence of lineages. The tips represent each Histoplasma isolate and are colour-coded according to its source; the percentage of each source of isolation was plotted in a pie chart. The state or country of isolation were added next to each taxa; two isolates had no information regarding the place of isolation (NI).
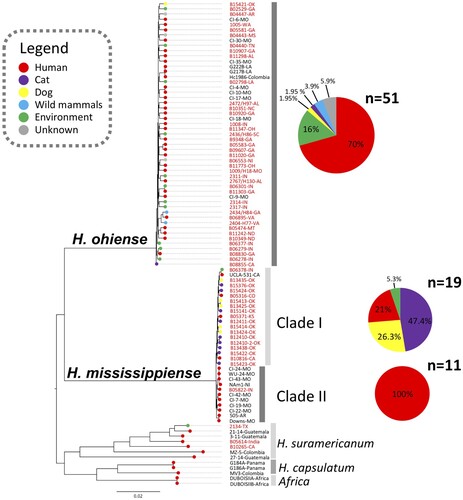
Figure 2. Diversity analysis and population genetic analysis of Histoplasma sp. in the USA. (A) Violin plot explaining the genome-wide dispersion of nucleotide diversity in Histoplasma ohiense and H. mississippiense (π). Red dots represent the average π values within each species. Structure plots and Principal Coordinate Analysis (PCA) suggests different patterns of population structure in Histoplasma ohiense and H. mississippiense together (B) or H. ohiense (C) and H. mississippiense (D) separately. Structure analysis revealed the presence or absence of cryptic populations which was inferred by the maximization of log-likelihood scores simulated in the fastSTRUCTURE software and is displayed in the upper panel of each comparisons. Each row represents an individual and the heights and colours of percentage of each population represent the probability of belonging to a given cluster. PCA plots are displayed in the lower panels and depicts the genetic variation distributed in two coordinates, PC1 and PC2, based on polymorphisms and similarities in the genomes of Histoplasma ohiense and H. mississippiense analyzed together or separately.
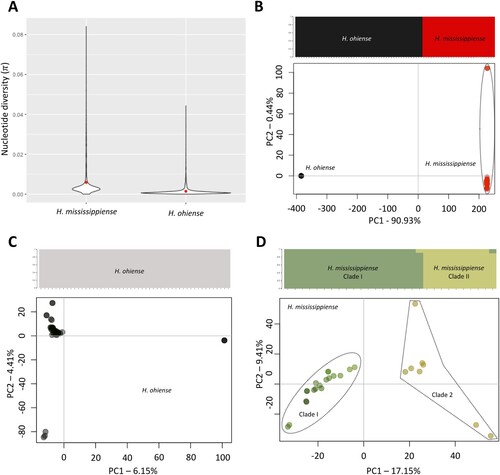
Figure 3. Geographic distribution of Histoplasma ohiense, H. mississippiense and H. suramericanum in the US territory. Eighty two isolates were genotyped using whole genome phylogenetic typing and were plotted as pie charts to each respective state of origin. Histoplasma ohiense is respresented by black while H. mississippiense and H. suramericanum are represented by grey and blue colours respectively. Two isolates had no information regarding the location of isolation. The background map is coloured in purple representing the known endemic area of histoplasmosis in the mid-eastern of US; hachure area represents potential endemic areas.
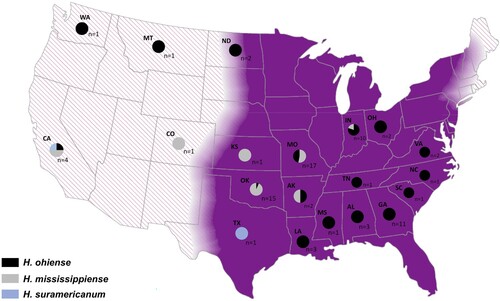
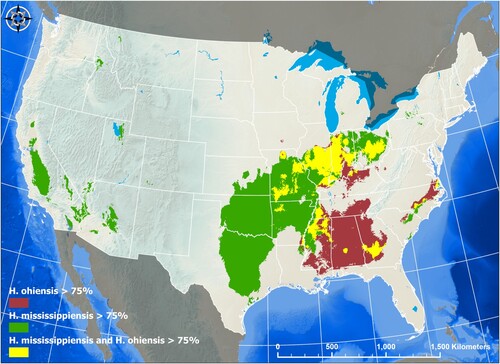
Figure 4. Species Niche Modelling of Histoplasma ohiense and H. mississippiense. The location of 152 Histoplasma typed by whole-genome or other methods were used as presence-only geographic data to generate species distribution models (SDM) based on the Maximum Entropy (MaxEnt) algorithm (25). Separate MaxEnt models were ran for the distribution of H. ohiense (red area) and H. mississippiense (green area) and performance was assessed using the area under the curve (AUC) of the receiver operating characteristic (ROC). In order to detect areas of niche overlap between the two species of Histoplasma, the predicted distributions were overlayed onto a map (yellow area). A threshold of predicted probability of 0.75 was set to examine areas of that have highest probability of species-specific areas as well as the overlapping areas.