
Figures & data
Figure 1. Vaccine design of RQ3025 and structural characterization of the expressed antigens. (A) An illustration of the composition of the RQ3025 Bivalent Vaccine, containing two mRNA sequences (RQ3013 and RQ3019) encoding the Spike protein of SARS-CoV-2. The furin cleavage site RRAR was replaced by GSAS.The last 18 amino acids were deleted. (B) Heatmap analysis of the mutation sites of the bivalent mRNA vaccine RQ3025 and the mutation sites of prevalent variant strains. (C) Western blots using different spike protein antibodies showing specificities of the antigens expressed by HEK293 T cells transfected with RQ3013, RQ3019, RQ3025, and Control. Purified RQ3013 and RQ3019 proteins were run in parallel on the same gels as positive control. (D) Localizations of the RQ3025, RQ3013 and RQ3019 RNA-encoded Spikes in HEK293 T cells transfected with the vaccine constructs were determined by immunofluorescence. Scale bar, 100 μm.
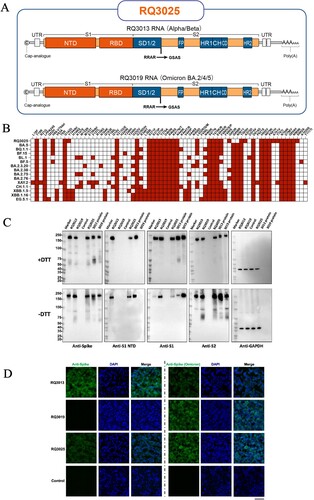
Figure 2. Immunogenicity of RQ3025 in BALB/c mice. (A) The immunization scheme for RQ3013, RQ3019 and RQ3025 in mice. Mice (n = 24 per group) were intramuscularly immunized with saline (Control), low dose (2 μg) or high dose (5 μg) of RQ3013, RQ3019 or RQ3025. Time points of vaccination, bleeding, and splenocyte isolation are indicated by arrows. Eight or six mice from each group were randomly selected for ELISA or neutralizing activity measurement, respectively, while the rest were used to detect the T cell responses. (B) IgG antibody responses were measured by analyzing the binding of antibodies to the wild-type RBD antigen, S proteins from the wild-type and SARS-CoV-2 variants, and the wild-type S2 subunit using sera collected on day 28 via enzyme-linked immunosorbent assay (ELISA). Values are geometric mean ± SD. (C) Neutralizing antibody titers in sera collected on day 28, analyzed by the lentiviral luciferase-based pseudovirus assay. The black dashed line indicates the assay's detection limit (reciprocal titer of 12.5). Values are geometric mean ± SD. (D) The FFA-based live virus micro-neutralization assay of week-6 sera against SARS-CoV-2 B.1.351 and XBB.1.5. The black dashed line indicates the assay's detection limit (reciprocal titer of 16). Values are geometric mean ± SD. (E) Summed IFN-γ ELISpot responses in splenocytes restimulated with peptides spanning the entire S protein. The splenocytes were collected on day 113. SFU, spot-forming units. Data are presented as mean ± SEM. (F) CD4+ and CD8+ T cell responses in isolated splenocytes at 92 days post-boost stimulated with either vehicle or pools of overlapping peptides derived from the SARS-CoV-2 S protein for 5 h, shown by flow cytometry analyses of IFN-γ, IL-2, TNF-α, IL-4 and IL-5 expressions. Background cytokine expression in the presence of vehicle alone was accounted for and subtracted from the measured responses elicited by the S1 and S2 peptide pools for each individual mouse. Data are presented as mean ± SEM. The significance analysis was conducted in comparison with the control group. (G) MSD assay showing IFN-γ, IL-4, IL-5, and IL-10 cytokine levels secreted by T cells restimulated with S1 and S2 peptide pools in isolated splenocytes 46 days post-boost. Data are presented as mean ± SEM. Statistical analyses were carried out by ANOVA and Tukey’s multiple comparison tests (*P < 0.05; **P < 0.005; ***P < 0.001; ****P < 0.0001).
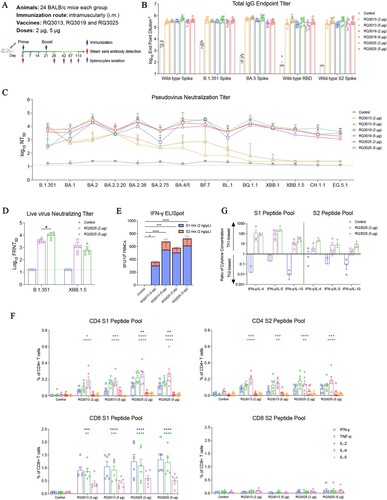
Figure 3. Immunogenicity of RQ3025 in K18-hACE2 transgenic mice. (A) The scheme of mice immunization. Mice were intramuscularly immunized with saline (Control), low dose (2 μg) or high dose (5 μg) of RQ3013, RQ3019 or RQ3025 (n = 16 per group). Time points of vaccination, bleeding, and splenocyte isolation are indicated by arrows. (B) ELISA analysis of IgGs binding to the wild-type RBD antigen, S proteins from the wild-type and SARS-CoV-2 variants, and the wild-type S2 subunit with sera collected on day 28. Values are geometric mean ± SD. (C) Neutralizing antibody titers in day-28 sera, analyzed by the lentiviral luciferase-based pseudovirus entry assay. The black dashed line indicates the detection limit of the assay (reciprocal titer of 12.5). Values are geometric mean ± SD. (D) The percentages of CD4+ and CD8+ T cells expressing IFN-γ, IL-2, and TNF-α were assessed using intracellular cytokine staining and flow cytometry in splenocytes collected 60 days after the second immunization and stimulated with a pool of peptides derived from either the S1 or S2 regions of the SARS-CoV-2 Spike protein. Data are presented as mean ± SEM. The significance analysis was conducted in comparison with the control group. Statistical analyses were carried out by ANOVA and Tukey’s multiple comparison tests (**P < 0.005; ***P < 0.001; ****P < 0.0001).
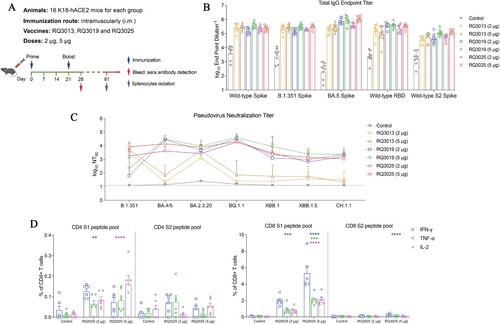
Figure 4. Protective efficacy of RQ3025 in K18-hACE2 transgenic mice. (A) The scheme of mice immunization. Mice were intramuscularly immunized with saline (Control) or low dose (2 μg) or high dose (5 μg) of RQ3025 (n = 5 per group). Time points of vaccination, viral challenge, and sample collection are indicated by arrows. Data collected from mice challenged with B.1.351 are shown in (B-E). (B) Live virus neutralization titers at 0 dpi and 4 dpi were detected by the FFA-based live virus microneutralization assay. The black dashed line indicates the detection limit of the assay (reciprocal titer of 16). Values are geometric mean ± SD. (C) Monitoring of body weight changes in K18-hACE2 mice following infection with the variant B.1.351. Data are presented as mean ± SEM. (D) Viral load in the lungs, tracheae and brains at 5 dpi was determined by RT-qPCR. Data are presented as geometric mean ± SD. (E) Histopathological examinations (hematoxylin and eosin (H&E) staining) of lungs from the challenged mice at 5 dpi. Scale bar, 100 μm. Data collected from mice challenged with BA.5 are shown in (F-I). (F) Live virus neutralization titers at 0 and 5 dpi were detected by the PRNT-based neutralization assay. The black dashed line indicates the detection limit of the assay (reciprocal titer of 50). Values are geometric mean ± SD. (G) Monitoring of body weight changes in K18-hACE2 mice following infection with the variant BA.5. Data are presented as mean ± SEM. (H) Viral load in the lung, trachea and brain tissues at 5 dpi was determined by RT-qPCR. Data are presented as geometric mean ± SD. (I) Histopathological examinations (H&E staining) of the lungs from infected mice at 5 dpi. Scale bar, 100 μm. Statistical analyses were carried out by ANOVA and Tukey’s multiple comparison tests (*P < 0.05; **P < 0.005; ***P < 0.001).
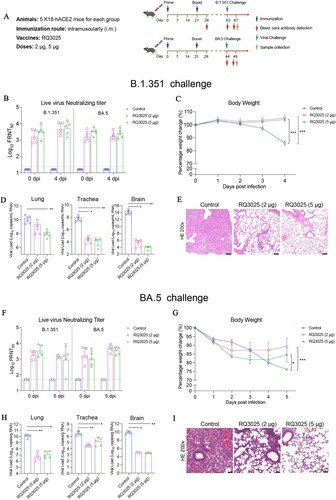
Figure 5. Immunogenicity and protective efficacy of RQ3025 in hamsters. (A) The immunization scheme for hamsters by RQ3013, RQ3019 and RQ3025. Hamsters were intramuscularly immunized with saline (Control), low dose (5 μg) or high dose (25 μg) of RQ3013, RQ3019 or RQ3025 (n = 10 per group). Time points of vaccination, bleeding, viral challenge, and sample collection are indicated by arrows. (B) Binding of IgGs to the wild-type RBD, S proteins from the wild-type and SARS-CoV-2 variants and the wild-type S2 subunit analyzed with sera collected on day 28 by ELISA. Values are geometric mean ± SD. (C) Neutralizing antibody titers in day-28 sera analyzed by the lentiviral luciferase-based pseudovirus assay. The black dashed line indicates the assay's limit of detection (reciprocal titer of 12.5). Values are geometric mean ± SD. (D) The FFA-based live virus microneutralization assay of week-6 sera against SARS-CoV-2 B.1.351 and BA.5. The black dashed line indicates the assay's detection limit (reciprocal titer of 16). Values are geometric mean ± SD. (E) Live virus neutralization titers at 0 and 5 dpi were detected by the PRNT-based neutralization assay. The black dashed line indicates the detection limit of the assay (reciprocal titer of 50). Values are geometric mean ± SD. (F) Body weight changes of hamsters following infection with the variant BA.5. Data are presented as mean ± SEM. (G) Viral load in the lungs at 5 dpi was determined by RT-qPCR. Data are presented as geometric mean ± SD. (H) Histopathological examinations (H&E staining) of the lungs from infected hamsters at 5 dpi. Black scale bar, 100 μm. Statistical analyses were carried out by ANOVA and Tukey’s multiple comparison tests (**P < 0.005; ****P < 0.0001).
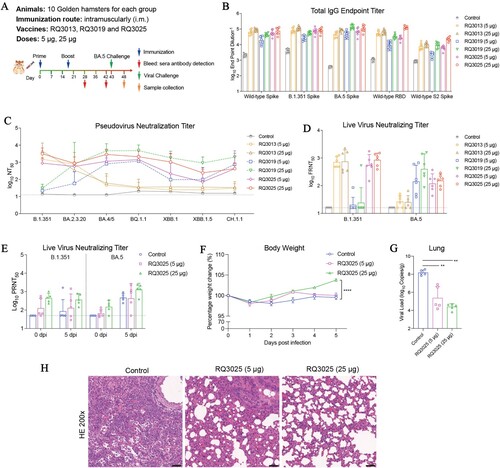
Figure 6. Immunogenicity of RQ3025 administered as a third booster in BALB/c mice previously received the inactivated vaccine. (A) The immunization scheme for the vaccines. BALB/c mice (n = 8 per group) were vaccinated on days 0 and 21 through the intramuscular route with a SARS-CoV-2 inactivated vaccine, and administered a booster dose of either the inactivated vaccine, RQ3013 or RQ3025 on day 77. Time points of vaccination, bleeding and splenocyte isolation are indicated by arrows. (B) Binding of IgGs to the wild-type RBD, S proteins from the wild-type and SARS-CoV-2 variants and the wild-type S2 subunit were analyzed with sera collected 4 weeks post-boost (on day 105) by ELISA. Values are geometric mean ± SD. (C) Neutralizing antibody titers in sera collected on day 105, analyzed by the lentiviral luciferase-based pseudovirus assay. The black dashed line indicates the assay's detection limit (reciprocal titer of 12.5). Values are geometric mean ± SD. (D) IFN-γ and IL-2 ELISpot assays on splenocytes collected 94 days after the third booster immunization (day 171) and stimulated with overlapping peptide pools derived from the S1 and S2 domains of the Spike protein. SFU, spot-forming units. Data are presented as mean ± SEM. (E) Flow cytometry analysis showing the percentages of CD4+ and CD8+ T cells expressing IFN-γ, IL-2 or/and TNF-α in splenocytes harvested 94 days after the last boost immunization (day 171) and stimulated with a pool of peptides derived from the S1 or S2 regions of the SARS-CoV-2 Spike protein, respectively. Data are represented as mean ± SEM. Statistical analyses were carried out by ANOVA and Tukey’s multiple comparison tests (**P < 0.005; ***P < 0.001; ****P < 0.0001).
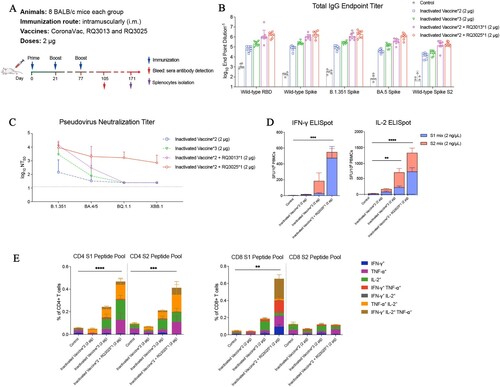
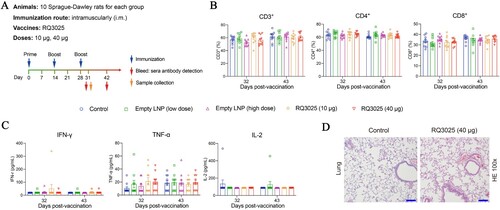
Figure 7. Safety evaluation of RQ3025 in Sprague-Dawley rats. (A) The immunization scheme for Sprague-Dawley (SD) rats. Rats (n = 10 per group) were immunized three times on days 0, 14, and 28 through intramuscular injections with the following substances respectively: Saline (Control), low dose RQ3025 (10 μg), high dose RQ3025 (40 μg), low dose and high dose of empty LNP. Time points of vaccination, bleeding, and sample collection are indicated by arrows. (B, C) Hematological analysis in all five groups of rats. Percentages of lymphocyte subsets including CD3+, CD4+, and CD8+, and expressions of cytokines IFN-γ, TNF-α, and IL-2 were monitored on days indicated. The black dashed line indicates the detection limit of the assay (IFN-γ, 9.40 pg/mL; TNF-α, 3.40 pg/mL; IL-2, 44.10 pg/mL). Any measurement below the detection limit was assigned a value of half the limit of detection for plotting and statistical purposes. Values are mean ± SEM. (D) Histopathological evaluations (H&E staining) in lungs from three groups of rats on day 31. Scale bar, 200 μm. Statistical analyses were performed using ANOVA and Tukey’s multiple comparison tests.
Supplementary_Information_sent
Download PDF (1.7 MB)Supplementary_Information_sent
Download MS Word (67.1 MB)Data availability
Data supporting the findings in this study are included in the main article and associated files.