
Figures & data
Figure 1. The level of IL16 is increased in Mtb-infected patients and mice. A The concentrations of 40 host markers in serum samples from patients with active TB, treated-TB, LTBI or healthy control using a multiplex cytokine platform (n = 5 to 8). B IL16 production by ELISA in serum samples from patients with active TB, treated-TB, LTBI or healthy control (n = 15 to 31). C to E Six to 8 weeks old female C57BL/6 mice were challenged intravenously with 1×10⁶ CFU of H37Rv. At 4 or 12 weeks after infection, the mice were sacrificed to determine IL-16 level in their serum samples (C), Bronchoalveolar lavage fluid (BALF) samples (D), and lung homogenates (E) (n = 6). Data represent means ± SEM. ∗p < 0.05, by 1-way ANOVA/Tukey’s multiple comparisons (B); Dots show the individual data, ∗p < 0.05, by Two-tailed Student’s t-test comparing H37Rv and control (C and D).
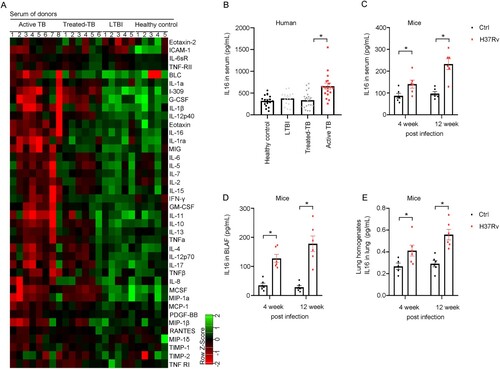
Figure 2. Macrophages are a major source of IL-16 secretion after Mycobacterium infection. A Analysis of lung cells from mice three weeks after Mtb infection revealed that IL-16-positive cell populations. B IL-16 level was increased as the rate of bacteria to monocytes-derived macrophages. Monocyte-derived macrophages were infected with M. marinum (MOI = 1:1, 5:1, 10:1) for 4 h. LPS and TNF were added at a concentration of 10 and 100 μg/mL, respectively. IL-16 in culture supernatants was quantified by ELISA (n = 6 to 8). C Thp-1 and RAW 264.7 were infected with M. marinum (MOI = 5:1) for 4 h. Three days post-infection (3 dpi), IL-16 was measured by immunofluorescence using confocal with a 63X oil objective. D and E Monocytes-derived macrophages were infected with H37Rv, H37Ra, BCG, M.smegmatis (MS) or M. smegmatis overexpressing RD1 (MS-RD1) at an MOI of 3:1 for 4 h. IL-16 production was measured by ELISA. LPS was added at a concentration of 100 μg/mL (n = 3 to 6). F Schematic diagram of lung macrophage depletion. Mice aged 6 to 8 weeks were administered clodronate liposomes or PBS control liposomes via the intravenous route (150 µL) and the intranasal route (50 µL) one day prior to infection. Then, C57BL/6 mice were intravenously challenged with 3.0×10⁶ CFU of H37Ra in 100 µL PBS. Three days post-infection, the mice were injected with clodronate liposomes or PBS control liposomes via the intranasal route (50 µL). G IL-16 level in BALF and serum 6 days post-infection, according to f (n = 3 to 5). data represent means ± SEM. ∗p < 0.05, by 1-way ANOVA/Tukey’s multiple comparisons (B, D, E); Dots show the individual data, **p< 0.001, ***p< 0.0001 by Two-tailed Student’s t-test comparing Clodrnote and PBS (G).
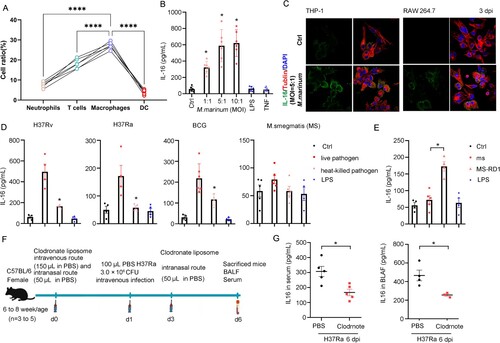
Figure 3. IL-16 secretion controls mycobacterium intracellular survival. A Alveolar macrophages (AMs) from wild-type (WT) or Il-16-/- mice were infected H37Ra at an MOI of 5:1 for 4 h. The mycobacterium uptake was measured by CFU counting at 1 hpi (n = 7 to 8). B Human monocytes-derived macrophages were pretreated with or without neutralized antibody anti-IL-16 (1 µg/mL), rhL-16 protein (10 ng/mL) for 18 h, infected with H37Rv (MOI = 3:1) for 4 h. Mycobacterium load was measured by CFU counting at 1, 3, and 7 dpi (n = 4 to 7). C H37Ra load was measured by CFU counting at 1 and 5 dpi, according to (A) (n = 6 to 8). D Bone Marrow-Derived Macrophages (BMDMs) from WT or Il-16-/- mice were infected H37Rv at an MOI of 3:1 for 4 h. The mycobacterium load was measured by CFU counting at 0 to 9 dpi (n = 3). *p<0.05 compared to media, Student's t-test. The graph shown is representative of 2 independent experiments.
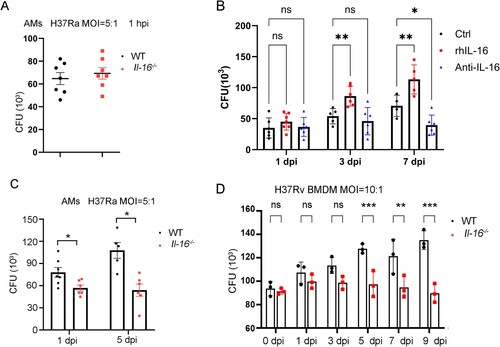
Figure 4. IL-16 deficiency promoted phagosome conversion in mycobacterium-infected macrophages. A to B WT and Il-16-/- BMDMs were infected with M.marinum (MOI = 10:1) in the presence or absence of rmL-16 protein (10 ng/mL). On day 2 post-infection, Rabbit Abs for M. marinum, mouse Abs for Lamp-1 (A), and mouse Abs for cathepsin D (B) were used. C Percent of co-localization of M. marinum and Lamp-1 or cathepsin D, according to A and B. D WT and Il-16-/- BMDMs were infected with H37Rv (MOI = 3:1) in the presence or absence of rmL-16 protein (10 ng/ml). On day 2 post-infection, Rabbit Abs for H37Rv, mouse Abs for Lamp-1, and mouse Abs for cathepsin D were used. E Percent of co-localization of H37Rv and Lamp-1 or cathepsin D, according to D. F Il-16-/- BMDMs were infected with H37Rv (MOI = 3:1) in the presence or absence of rmL-16 protein (10 ng/mL), rabbit anti CD4 or IL-16 and control IgG were added. On day 2 post-infection, Rabbit Abs for H37Rv, mouse Abs for Lamp-1, and mouse Abs for cathepsin D were used. G Western blotting analysis was used to examine the activation of PI3 K, AKT, mTOR, according to F. *p<0.05 compared to media, Student's t-test. The graph shown is representative of 2 independent experiments.
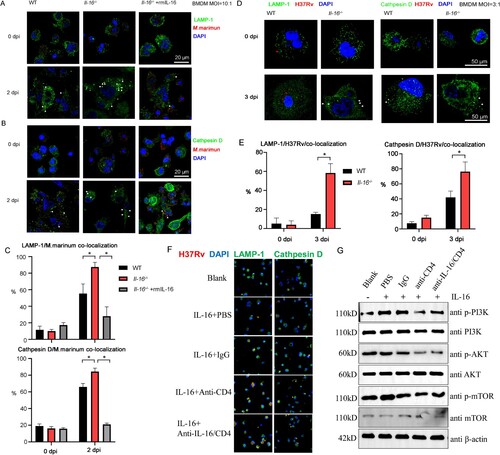
Figure 5. IL-16 production repressed Rev-erbα expression in macrophages response to mycobacterium challenge. A and B Monocyte-derived macrophages were pretreated with or without neutralized antibody anti-IL-16 (1 µg/mL) or rhIL-16 protein (10 ng/mL) for 18 h. Then, the cells were infected with M. marinum (MOI = 5:1) for 4 h. Afterward, the cells were washed to remove unphagocytosed bacteria and further incubated with or without blocking antibodies (1 µg/mL) or rhL-16 (10 ng/mL) for additional time. Immunofluorescence by confocal imaging was used to detect the nuclear expression of Rev-erbα (A) and LXR4 (B) at 3 dpi. C Western blotting analysis was used to examine the expression of Rev-erbα, according to A. D WT or Il-16-/- BMDMs were infected with H37Rv (MOI = 3:1) for 4 h, washed to remove unphagocytosed bacteria and incubated for additional time with or without rhL-16 (10 ng/mL). Rev-erbα protein level was determined by Western blotting at 3 dpi. E Immunofluorescence was used to detect the nuclear expression of pro-IL-16 in monocyte-derived macrophages infected with M. marinum (MOI = 3:1) at 3 dpi by confocal analysis. F A bioinformatic search revealed a putative GAPBAα response motif flanked by a 12 bp sequence of TCTCTCCCGGTC in the Rev-erbα promoter. Ch-IP, re-ChIP and PCR assay were performed in macrophages infected with M. marinum (MOI = 5:1) at 3 dpi. Normal anti-IgG (2 μg), anti-pro-IL16 (2 μg), anti-GAPBα (2 μg) and anti-HDAC3 (2 μg) Abs were used for each immunoprecipitation. PCRs with non-immunoprecipitated genomic DNA (Input) were also performed as control. G Relative level of PCR- amplified Rev-erbα DNA by Image J, according to F. *p<0.05 compared to media, Student's t-test. The graph shown is representative of 2 independent experiments.
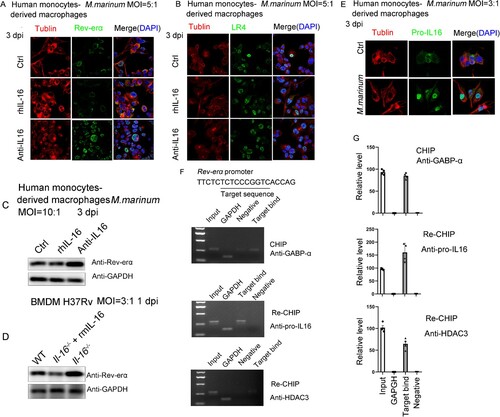
Figure 6. IL-16 impaired the clearance of M. marinum in zebrafish larvae. A Timeline of animal vaccination, infection and killing. Zebrafish larvae were injected with morpholino (MO)-IL-16 (10 ng), MO-control (10 ng), MO-IL-16 (10 ng) plus human IL-16 mRNA (100 pg) at 0-0.5 h.p.f. Zebrafish infection with M. marinum was performed via caudal vein injection with 1.0 to 1.5 nl per fish of a single-cell bacterial suspension in PBS at a dosage of 5.0×10⁷ CFU/mL at 30 h.p.f. B The relative level of IL-16 mRNA by qPCR in zebrafish larvae injected with morpholino oligos at indicated time (n = 12 to 20). C To assess the bacterial burdens, the homogenates of fish livers were plated onto 7H10 agar by serial dilution to determine CFU at 3 and 7 dpi (n = 8 to 36). D and F The overall reduction of infection level was determined by fluorescence microscopy. E and G Ziehl-Neelsen acid-fast staining was performed on 5 μm sections for gross pathology. H The survival of zebrafish during a 14-day infection. data represent means ± SEM. ∗p < 0.05, by 1-way ANOVA/Tukey’s multiple comparisons (B, C); A pool of 2 experiments is shown, including 15 to 22 zebrafish larvae per group as indicated, ∗∗p < 0.01 by log-rank test (H).
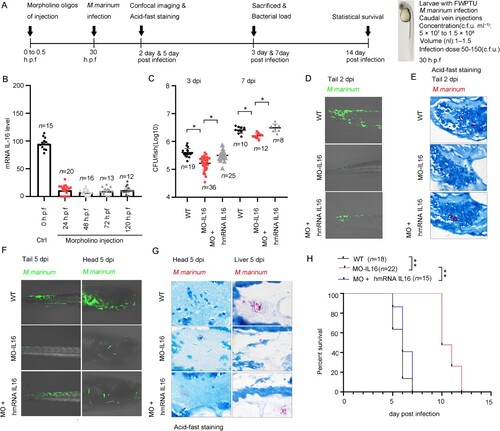
Figure 7. Interleukin 16 deficiency reduced the host susceptibility to H37Rv infection. A Schematic diagram of infection experiments. C57BL/6 or Il-16-/- mice were infected with ∼200 CFU of H37Rv using a Glas-Col inhalation exposure system (n = 6 to 8). B At 3-, 7- and 28-days post-infection, the mice were sacrificed, and bacterial counts in the lungs and spleens were determined on Middlebrook 7H10 agar. Mtb colonies were incubated at 37 °C and counted after 21 days (n = 6). C For histopathology analysis, half of each lung was fixed in a 4% neutral-buffered paraformaldehyde solution for 24 hours. Lung tissue was then embedded in paraffin. A series of sections with a thickness of 4-7 μm were then cut and stained with hematoxylin and eosin by standard methods. D Histopathology analysis was evaluated by pathologists in a blinded manner (n = 6). E LAMP-1 and Cathepsin D expression were analyzed by immunohistochemistry. F H-Score analysis was determined according to E. The values are the means ± SEM, 6 to 8 mice per group as indicated. *p<0.05 compared to media, Student's t-test.
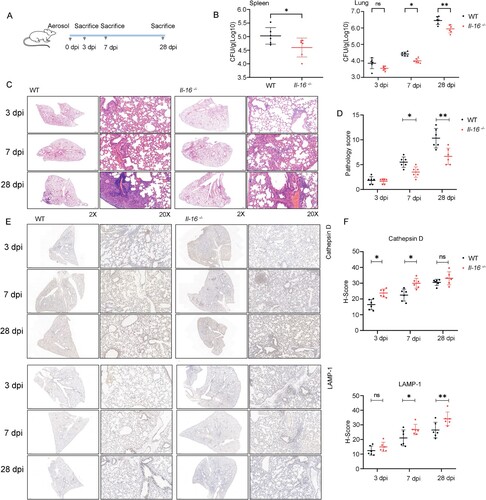
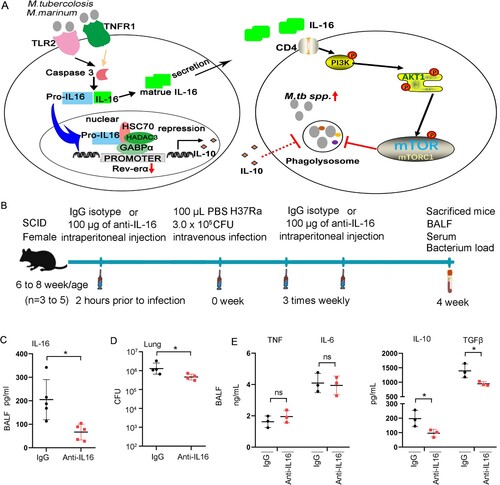
Figure 8. Neutralization of IL-16 contributes to host control of Mycobacterium infections. A Schematic diagram of GAPBAα/Pro-IL16/HDAC3 complex regulates Rev-erbα expression and IL-16 regulates the maturation of phagolysosomes through CD4. B Schematic diagram of neutralization of IL-16 in vivo. 6-8 weeks of age mice were intraperitoneally injected with 200 μg anti-IL-16 neutralizing mAb 2 h prior to infection. Mice were challenged with 3×10⁶ CFU of H37Ra in 100 μL PBS via the intravenous route, followed by intraperitoneal injection 3 times weekly with 200 μg anti-IL-16 neutralizing mAb. Control mice received 200 μg isotype-matched mouse IgG2a(κ). The mice were sacrificed 4 weeks post-infection (n = 3 to 5). C IL-16 level in BALF by ELISA (n = 3 to 5). D H37Ra load in lung (n = 3 to 5). E TNF, IL-6, IL-10 and TGF-β levels in BALF measured by ELISA (n = 3 to 5). *p<0.05 compared to media, Student's t-test. The graph shown is representative of 2 independent experiments.
Supplementary_Figures
Download Zip (38.4 MB)Supplementary_information
Download MS Word (33.2 KB)Data availability statement
All data generated or analyzed during this study are included in this article and its supplementary information files. Further inquiries can be directed to the corresponding author.