Figures & data
Figure 1. Cell tropism of HCoVs in human respiratory organoids. (a) Scheme of this study. (b) Cell tropism of five HCoVs in hNOs. (c) Cell tropism of five HCoVs in hLOs. hNOs and hLOs were infected with five HCoVs respectively (MOI = 1). Organoid samples were harvested at 48 hpi (n = 3). Immunofluorescence staining was performed. Cell nuclei (DAPI, blue), virus (NP, red), and epithelial cell markers (ciliated cells: ACCTUB, club cells: CC10, goblet cells: MUC5AC, alveolar type II cells: SFTPC, green) were stained. Scale bar = 50μm.
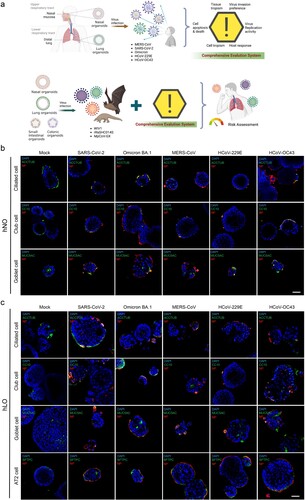
Table 1. Comprehensive weighted score.
Figure 2. Replication and invasion variability of HCoVs in human respiratory organoids. (a) Five HCoVs show distinct variability in hNOs and hLOs. hNOs and hLOs were infected with five HCoVs respectively (MOI = 0.1). Samples were harvested at 3, 24, 48 and 72 hpi. Viral load in culture supernatant or within cells was quantified by qRT-PCR on total viral RNA (NP gene as target) (n = 3). Dashed line in supernatant plot: effective release, virus amplification more than 100-fold; dashed line in intracellular plot: effective replication, virus amplification more than 10-fold. (b and c) Different HCoVs exhibit distinct invasion mechanisms in hNOs and hLOs. Organoids were pre-treated with 100 μM E-64D or camostat mesylate for 1 h (camostat mesylate, a TMPRSS2 inhibitor; E64-D, a CTSL/B inhibitor) before infected with five HCoVs respectively (MOI = 1). Organoid cell samples were collected at 24 hpi. Viral load in cells was quantified by qRT-PCR on total viral RNA (NP gene as target) (n = 3). Data are the mean ± SEM. Statistical significance is analysed by Student’s t-test (*p < 0.05; **p < 0.01; ***p < 0.001; ****p < 0.0001).
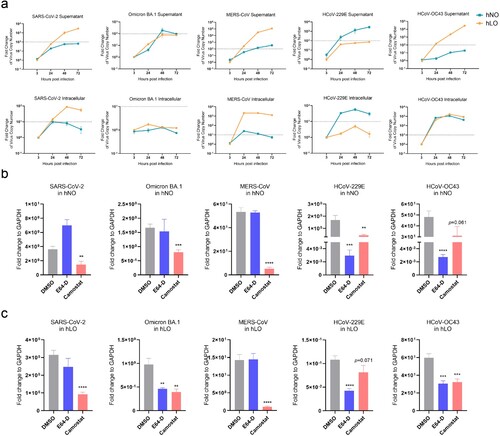
Figure 3. Human respiratory organoids support replication of HCoVs. (a) Differential sgRNA replication activity of five HCoVs in hNO cells. (b) Differential sgRNA replication activity of five HCoVs in hLO cells. (c) Variation in the viral titres of five HCoVs in the culture supernatant of hNO cells. Dashed line: the lowest limit of detection threshold. (d) Variation in the viral titres of five HCoVs in the culture supernatant of hLO cells. Dashed line: the lowest limit of detection threshold. hNOs and hLOs were infected with five HCoVs respectively (MOI = 0.1). Samples were harvested at 3, 24, 48 and 72 hpi (n = 3). Viral load in organoid cells was quantified by qRT-PCR and viral load in culture supernatant was quantified by plaque assay. Error bars represent the mean ± SEM.
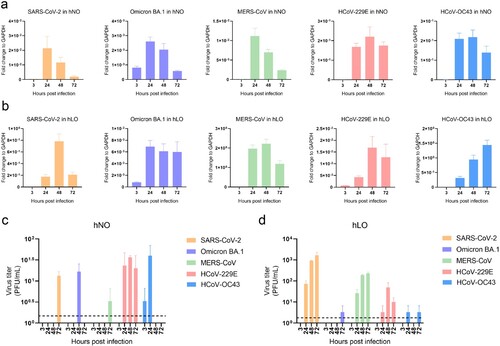
Figure 4. Host responses to HCoV infection in hLOs. (a) Induction of antiviral and inflammatory responses by infection of five HCoVs (MOI = 0.1). Organoid cell samples were harvested at 24, 48 and 72 hpi (n = 3). Gene expression was quantified by qRT-PCR. (b) Proportion of infected cells in hLOs after viral infection (MOI = 1). (c) Cell death and apoptosis rates induced by virus infection (MOI = 1). Organoid samples were digested into single cells, stained with apoptosis and death probe, fixed, and labelled with virus NP antibodies for flow cytometry analysis (n = 3). Data are the mean ± SEM. Statistical significance is analysed by Student’s t-test (*p < 0.05; **p < 0.01; ***p < 0.001).
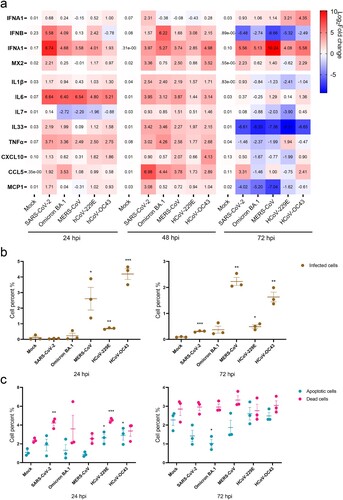
Figure 5. Tissue Tropism and Invasion Mechanism Preferences of animal-borne coronaviruses. (a) Replication levels of three animal-borne coronaviruses in hNOs, hLOs, hIOs and hCOs (MOI = 0.1, n = 3). Dashed line in supernatant plot: effective release, virus amplification more than 100-fold; dashed line in intracellular plot: effective replication, virus amplification more than 10-fold. (b) Impact of protease inhibitors on three animal-borne coronaviruses in hNOs and hLOs (MOI = 1, n = 3). (c) SgRNA levels of three animal-borne coronaviruses in hNO and hLO cells (MOI = 0.1, n = 3). (d) Virus titres of three animal-borne coronaviruses in hNO and hLO culture supernatants (MOI = 0.1, n = 3). Dashed line: the lowest limit of detection threshold. Data are the mean ± SEM. Statistical significance is analysed by Student’s t-test (**p < 0.01; ****p < 0.0001).
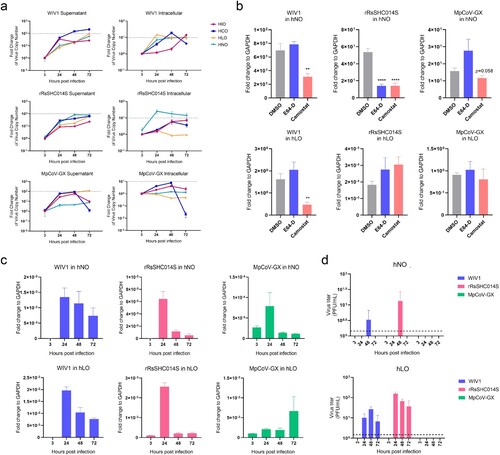
Figure 6. Host responses to animal-borne coronavirus infection in hLOs. (a) Induction of antiviral and inflammatory responses by infection of three animal-borne coronaviruses (MOI = 0.1). Organoid cell samples were harvested at 24, 48 and 72 hpi (n = 3). Gene expression was quantified by qRT-PCR. (b) Proportion of infected cells in hLOs after viral infection (MOI = 1). (c) Cell death and apoptosis rates induced by infection (MOI = 1). Organoid samples were digested into single cells, stained with apoptosis and death probe, fixed, and labelled with virus NP antibodies for flow cytometry analysis (n = 3). Data are the mean ± SEM. Statistical significance is analysed by Student’s t-test (*p < 0.05; **p < 0.01; ***p < 0.001; ****p < 0.0001).
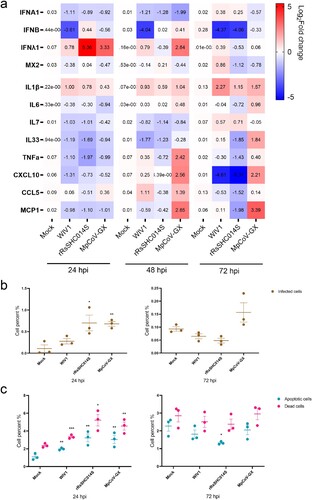
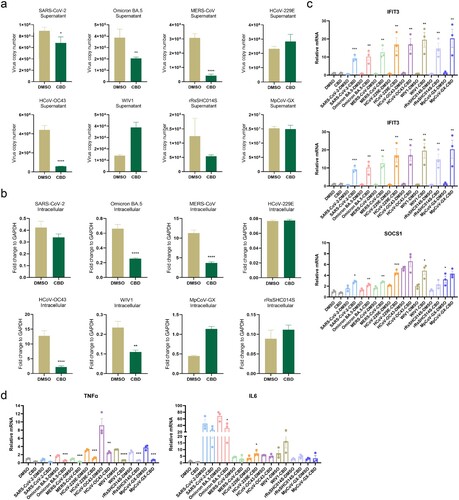
Figure 7. CBD as a potential broad-spectrum inhibitor of coronaviruses (a) Changes in viral load in hLO culture supernatant after CBD treatment. (b) Changes in viral load in hLO cells after CBD treatment. (c) Changes in ISG response in hLOs after CBD treatment. (d) Changes in inflammatory response in hLO after CBD treatment. HLOs were pre-treated with 10 μM CBD for 12 h before infection with eight coronaviruses respectively (MOI = 1). After infection, the hLOs were cultured with 10 μM CBD for 24 h (n = 3) before harvest. Viral load or related gene expression was then quantified by qRT-PCR. Data are the mean ± SEM. Statistical significance is analysed by Student’s t-test (*p < 0.05; **p < 0.01; ***p < 0.001; ****p < 0.0001). In figure c and d, pairwise comparisons were performed between the CBD-treated and DMSO-treated groups for each set of experiments.