Figures & data
Figure 1. Viral load graphs of some of the tCHI participants in this study. (A) Individual participant tracking shown. P12, P13, P14, and P15 received stable cART for less than two years at the time of sample collection. P6, P29, P31, and P32 had intermittent tracking of viral load during the course of their 225, 4221, 2889, and 2581 days on treatment, respectively. Graphs for these participants are not shown. (B) One cumulative overlay of the participants graphed in Panel A, best fit curve was constructed using LOWESS smoother by statsmodels v.0.15.0.
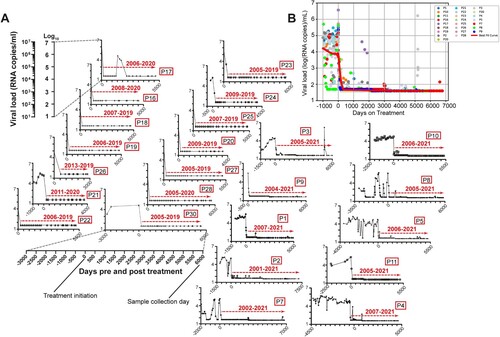
Figure 2. HLP_B induces potent latency reversal in CD4+ T cells from tCHI. Latency reversal assay was conducted using HLP, CTF, αCD3/CD28, and PMA/Iono. (A) Viral copy number was determined via qRT-PCR from culture supernatants (geometric mean shown for scatter, median is shown for box–whisker plots). (B) IFN-γ was measured via ELISpot (geometric mean shown for scatter, median for box–whisker). ELISpot wells were shown and purple dots are spot forming units (SFU), from participant 4 and 10 with subtype B infection. Raw SFU counts used 1 or 2 × 10⁵ cells/well, and were presented in the graph adjusted to 1 × 10⁶ cells/mL for consistency to assay for viral release analysis in Panel A. Next, intra-donor comparison for T cell activation by IFN-γ ELISpot was analyzed between HLP and (C) Media or (D) CTF. (E) The ratio of HIV vRNA copies per IFN-γ activated cell from culture supernatants was calculated (geometric mean), with intra-donor pairwise alignment comparison between HLP and either (F) CTF or (G) PMA/Iono. (H) The ratio of HIV msRNA copies per IFN-γ activated cell from infected cells was calculated, with intra-donor pairwise alignment comparison between HLP and either (I) CTF or (J) PMA/Iono. Each pair of datapoints connected by a line is from one donor. Kruskal–Wallis with Dunn’s post-hoc tests were performed to account for inter-sample multiple comparisons, and two-tailed Wilcoxon matched-pairs signed rank tests were performed for intra-sample significance. Paired comparisons between every condition were performed, only the statistically significant comparisons are denoted. *p < 0.05, **p < 0.01, ***p < 0.001, ****p < 0.0001; L.O.D, limit of detection; SFU, spot forming units; msRNA, multiply-spliced RNA; TNTC, too numerous to count.
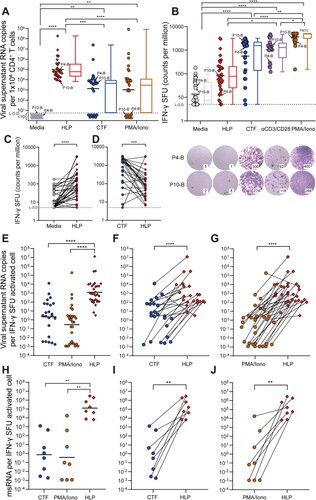
Figure 3. HLP-induced HIV-1 has high genetic diversity when reactivated from tCHI samples. The genetic diversity of induced HIV-1 subtype D sequences after latency reversal is shown. HIV-1 sequences spanning the LTR-gag and env (C2-V3) regions were analyzed using Sanger and Oxford Nanopore (A) and Illumina MiSeq (B), respectively. Reference sequences for subtypes A, B, C, and D were included for comparison, while HLP_DNA sequence was also included. (C) A HighlineR plot showing HLP-induced HIV-1 C2-V3 diversity from participant 18. The horizontal grey bands correspond to each unique sequence read, while the band sizes represent the frequency of each read. The highlineR package designates the most common read as the master sequence and places it at the top of the plot. The diversity of other reads is then computed relative to this master sequence. Differences relative to the master sequence are shown as coloured tick marks on each grey band, indicating the nucleotide positions with change. For the brevity and easy visualization, only reads with frequencies >3 were shown in the plot. HighlineR plots for remaining donors are found in Supplementary Figure 4.
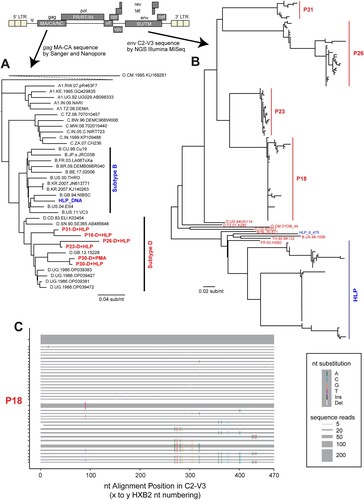
Figure 4. HLP_B induces significantly greater latency reversal in tCHI samples than in tAHI samples. (A) Viral copies in culture supernatant from latency reversal assay were measured by qRT-PCR. (B) Activation of CD4+ T cells was determined by SFU count via IFN-γ ELISpot assay. (C) The ratio of HIV vRNA copies per IFN-γ activated cell was calculated. Each datapoint represents one donor from the respective cohort. (D) Comparison of three HLP formulations (HLP_B, _D, and _A + D) on latency reversal efficiency in the tCHI cohort and intra-donor pairwise alignment comparison among three HLP formulations and CTF was shown. Each pair of datapoints connected by a line is from one donor. Two-tailed Mann–Whitney tests were performed to test inter-sample significance, and two-tailed Wilcoxon matched-pairs signed rank tests were performed to test intra-sample significance. *p < 0.05; **p < 0.01; ***p < 0.001; ****p < 0.0001. HLP, HIV-1/virus-like particle; SFU, spot forming units; L.O.D, limit of detection. Geometric mean shown for scatter, median is shown for box–whisker plots.
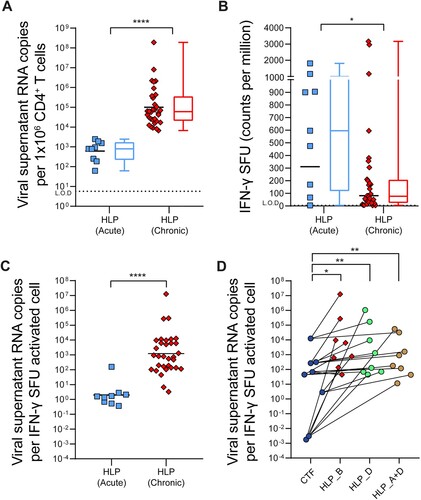
Figure 5. HLP outperforms clinically relevant LRAs at induction of viral transcripts. (A) After LRA stimulations, we measured induced HIV-1 reactivation by qRT-PCR of viral RNA detected in supernatant. (B) Activation of CD4+ T cells with LRAs was determined by IFN-γ ELISpot. Purple dots are spot forming units (SFU) from ELISpot wells, from participant 31 with subtype D infection. Raw SFU counts used 1 or 2 × 10⁵ cells/well, and were presented in the graph adjusted to 1 × 10⁶ cells/mL for consistency to assay for viral release analysis in Panel A. Each datapoint represents one donor. Kruskal–Wallis with Dunn’s post-hoc tests were performed to account for inter-sample multiple comparisons. Paired comparisons between every condition were performed, only the statistically significant comparisons are denoted. *p < 0.05; **p < 0.01; ***p < 0.001; ****p < 0.0001. HLP, HIV-1/virus-like particle; LRA, latency reversal agent; L.O.D, limit of detection; TNTC, too numerous to count. Geometric mean shown for scatter, median is shown for box–whisker plots.
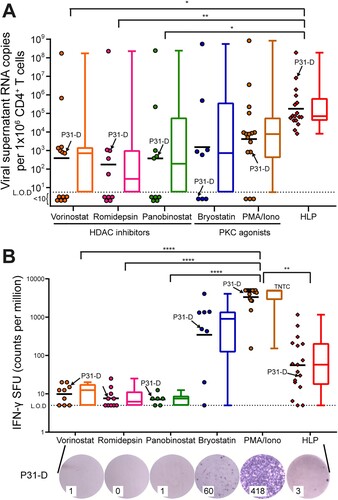
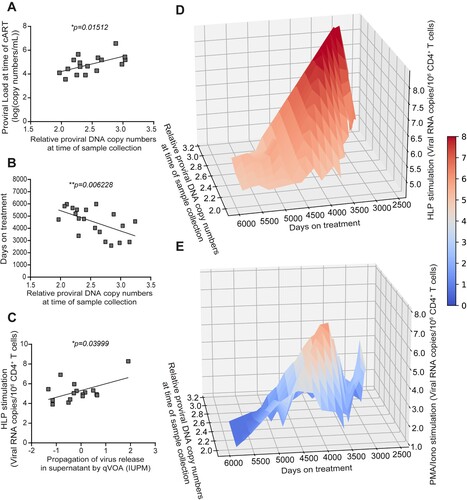
Figure 6. Correlation analysis between proviral load, propagation of virus release in supernatant by qVOA (IUPM), and viral copies in supernatant stimulated by HLP measured by qRT-PCR. (A) Correlation between proviral load at the time point starting combination anti-retroviral treatment (cART) and proviral load at sample collection. (B) Correlation between proviral load at sample collection and time of cART treatment (days). (C) Correlation between viral RNA copies in culture supernatant from latency reversal assay by HLP and measured by qRT-PCR, and a quantitative viral outgrowth assay (qVOA) used a limiting dilution of primary T cells co-cultured with MOLT-4/CCR5 cells to stimulate those cells harbouring latent HIV to propagate further infection, an amount that was expressed as IUPM, infectious units per million cells. Each datapoint represents one donor. (D) A 3D correlation was mapped comparing time of treatment (days) and proviral DNA copy numbers at time of sample collection and viral RNA copies in culture supernatant from latency reversal assay by HLP and measured by qRT-PCR. (E) A 3D correlation was mapped comparing time of treatment (days) and proviral DNA copy numbers at time of sample collection and viral RNA copies in culture supernatant from latency reversal assay by PMA/Iono and measured by qRT-PCR. Colour bar corresponds to the z-axis. A two-tailed Pearson Correlation Coefficient test was used to assess significance (*p < 0.05; **p < 0.01). HLP, HIV-1/virus-like particle.