Figures & data
Table 1. Oligonucleotides / primers used in this study.
Figure 1. Impact of LDLR-blocking on infection with porcine pestiviruses. (A) PK15 cells were pre-incubated with either anti-LDLR polyclonal antibody (anti-LDLR) or non-relevant anti-CD45 antibody (control) and infected with CSFV strain Kozlov or BuPV. After infection, the respective antibody was added again for the incubation period of 20 h. Infections were evaluated by immunofluorescence (IF) staining of pestiviruses using mab C16 for CSFV or porcine BuPV-specific antiserum, respectively, in combination with either isotype-specific anti-mouse IgG1 (orange) or anti-swine (red) secondary mab. Nuclei were stained with DAPI (blue) to confirm the presence of confluent monolayers (small pictures in lower left corners). Representative pictures from three independent experiments are shown. (B, left) Infections were quantified as infected areas in IF by pixel counting using ImageJ. Orange/red pixels (detected in virus-positive cells) were normalized against blue pixels (detected in cell nuclei). Bars represent mean values from 15 pictures comprising five pictures from each of the three independent experiments, respectively. Standard deviations are indicated. (B, right) Infectious viral titers in the supernatants from infected cells were determined by endpoint dilution assay in quadruplicates. Bars represent mean 50% tissue culture infectious doses per ml (TCID50/ml) from three independent experiments. Standard deviations are indicated. (B) Significance of differences was calculated by unpaired t-tests with Welch's correction (*p < 0.05, **p < 0.01, ***p < 0.001).
Figure 2. Genome editing strategy and genetic characterization of engineered embryonic porcine kidney cells (SPEV). In the top rows, the LDLR consensus nucleotide and amino acid sequences present in SPEV wild type (WT) cells are depicted. The first 45 nucleotides (nt) of the sequence encoding for the signal peptide (SP; total length: 66 nt) including the start codon (highlighted in green) as well as the position of the CRISPR/Cas9 guide RNA (gRNA, highlighted in blue) and its protospacer adjacent motif (PAM, highlighted in grey) are shown. Below, the nucleotide and deduced amino acid sequences obtained from the genetically engineered (modified) cell line are given. Deletions of 12 and 45 nt (Δ12 nt, Δ45 nt) are boxed in red. For trans-complementation of LDLR, the gRNA and PAM sequence were altered by introduction of four silent mutations (nucleotides to be mutated highlighted in bold).
Figure 3. Phenotypic characterization of engineered embryonic porcine kidney cells (SPEV). (A) The LDLR expression of SPEV wild type (WT), CRISPR/Cas9-edited low-LDLR (low) and trans-complemented high-LDLR (high) cells was analyzed by Western Blot. LDLR in cell lysates and membrane protein preparations (membrane) was detected by either a monoclonal LDLR antibody (LDLR mab) or a polyclonal LDLR antibody (LDLR pab) in combination with a fluorescent secondary antibody. The housekeeping protein beta-Actin served for normalization. LDLR in membrane protein preparations was additionally quantified using the plasma membrane marker protein Ezrin (boxed, detected on a different blot with high-LDLR sample diluted 1:2). (B) SPEV WT, low-LDLR and high-LDLR cells were investigated for their total LDLR expression (top row) and LDL uptake (bottom row) by immunofluorescence (IF) microscopy. LDLR was stained after heat fixation, using the LDLR mab in combination with anti-rabbit secondary mab (orange). For analysis of LDL uptake, cells were deprived of FBS for 4 h before addition of fluorescent-labelled DiI-LDL (orange) for 1 h. (C) LDLR expression and LDL uptake were quantified by measuring the brightness of IF pictures using the ImageJ software and normalization against cell numbers. For each cell line, five pictures were taken and the experiments were repeated three times. Standard deviations are indicated. Significance of differences in LDLR expression was calculated by Brown-Forsythe and Welch ANOVA tests with Dunnett's T3 multiple comparisons correction and significance of differences in LDL uptake was calculated by Kruskal-Wallis test with Dunn's multiple comparisons correction (*p < 0.05; **p < 0.01; ***p < 0.001).
Figure 4. Impact of different LDLR expression levels on infection with porcine pestiviruses. (A) SPEV WT, low-LDLR and high-LDLR cells were infected with CSFV strain Kozlov and BuPV. Infections were evaluated at 20 and 72 hpi by immunofluorescence (IF) staining of pestiviruses using mab C16 for CSFV or porcine BuPV-specific antiserum, respectively, in combination with either anti-mouse (orange) or anti-swine (red) secondary mab. Nuclei were stained with DAPI (blue) to confirm the presence of confluent monolayers (small pictures in lower left corners). Representative pictures from three independent experiments are shown. (B) Infections were quantified as infected areas in IF by pixel counting using ImageJ. Orange/red pixels (detected in virus-positive cells) were normalized against blue pixels (detected in cell nuclei). Bars represent mean values from 15 pictures comprising five pictures from each of the three independent experiments, respectively. Standard deviations are indicated. Significance was calculated by Kruskal-Wallis test with Dunn's multiple comparisons correction (*p < 0.05, **p < 0.01, ***p < 0.001). (C) Infectious viral titers in the supernatants harvested from the infection experiments at 20 and 72 hpi were determined by endpoint dilution assay in quadruplicates. Bars represent mean 50% tissue culture infectious doses per ml (TCID50/ml) from three independent experiments. Standard deviations are indicated. Significance was calculated by ordinary one-way ANOVAs with Tukey’s multiple comparisons correction (*p < 0.05, **p < 0.01, ***p < 0.001).
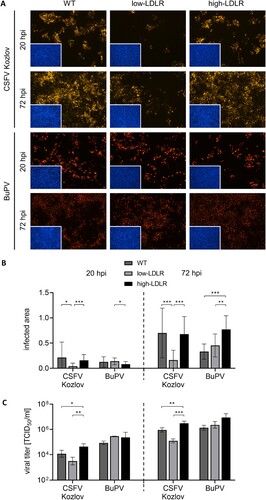
Figure 5. Impact of soluble LDLR on infection with porcine pestiviruses. (A) Recombinant soluble LDLR (sLDLR) represents the ectodomain of porcine LDLR consisting of the ligand binding domain (LBD), epidermal growth factor precursor homology domain (EGFPH) and O-linked sugar domain (OLS), lacking the transmembrane domain (TM) and cytoplasmic tail (CP) of native LDLR. TM and CP were replaced by a peptide containing a Twin Strep tag for affinity purification (not shown). Created with BioRender.com. (B) Purified fractions containing recombinant sLDLR were pooled and subjected to Western Blot analysis. sLDLR was detected using either a polyclonal LDLR antibody (LDLR pab) or a Strep-Tactin HRP conjugate (Strep-Tactin) binding to the Twin Strep tag. (C) CSFV strain Kozlov, BuPV and rVSV containing an eGFP-encoding sequence for green self-fluorescence were pre-incubated with either recombinant sLDLR, Strep tag control protein (Strep-tag II) or protein diluent (control) before infection of PK15 cells. After infection with CSFV and BuPV, the respective protein was added again for the incubation period of 20 h. Pestivirus infections were evaluated by immunofluorescence (IF) staining using mab C16 for CSFV or porcine BuPV-specific antiserum, respectively, in combination with either anti-mouse (orange) or anti-swine (red) secondary mab. Nuclei were stained with DAPI (blue) to confirm the presence of confluent monolayers (small pictures in lower left corners). rVSV infection of cells was monitored by eGFP expression (green) performing live cell imaging at 5 hpi. The presence of confluent monolayers was verified by bright field microscopy (yellow, small pictures in lower left corners). (D) CSFV and BuPV infections were quantified as infected areas in IF by pixel counting using ImageJ. Orange/red pixels (detected in virus-positive cells) were normalized against blue pixels (detected in cell nuclei). Bars represent mean values from 15 pictures comprising five pictures from each of the three independent experiments, respectively. Standard deviations are indicated. Significance was calculated by Kruskal Wallis test with Dunn's multiple comparisons correction (*p < 0.05, **p < 0.01, ***p < 0.001).