
Figures & data
Table 1. Summary samples collected from pig farms in Guangxi, China, from March 2018 to July 2023.
Figure 1. swIAVs identified in 12 prefectures of Guangxi in 2018–2023. (A) The location of the Guangxi Autonomous Region in China. (B) The 12 prefectures in Guangxi from which samples were collected from pigs for this study are shown in the colours used in panel B. The two prefectures shown in grey were not sampled. The prefecture’s two-letter acronyms are identical to those listed in . Each coloured circle represents a single clinical sample obtained from pigs for this study. The swIAV-positive samples in all locations are coloured in red.
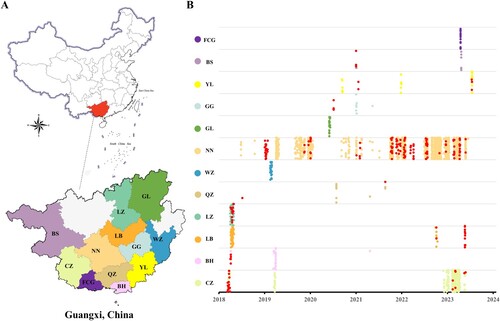
Figure 2. Multiple genotypes and lineages of swIAVs in Guangxi, China. (A) Multiple lineages from swine, human and avian lineages of swIAVs which co-circulated in Guangxi (GX). (B) Genotypes of the different swine influenza A virus (swIAV) identified in Guangxi, including the previously described genotypes and obtained in this study. The eight bars represent the eight gene segments and the colours of the bars indicate the lineage of origin of the gene segments, corresponding to A. (C) Genotypes of EA H1N1, HL H3N2 and pdm09-like H1N2 swIAVs in this study. (D) Contributions (%) of various genetic lineages to gene segments in the 158 reassortant swIAV strains in Guangxi during 2011 and through 2023.
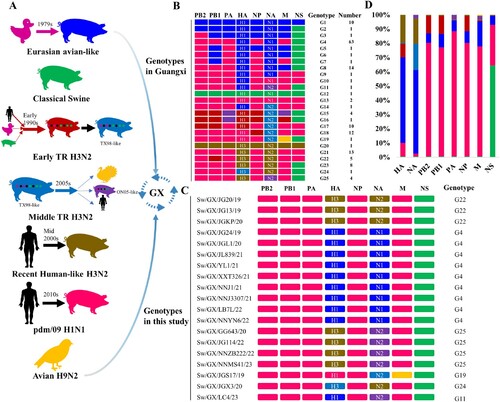
Figure 3. Phylogeny and divergence time of M genes of swIAVs isolates in Guangxi. The phylogenetic tree of the M gene was generated by using the Bayesian MCMC framework, using the GTR substitution model with gamma-distribution among the site rate heterogeneity and a “strict molecular clock” model. The branches are coloured according to their host origin.
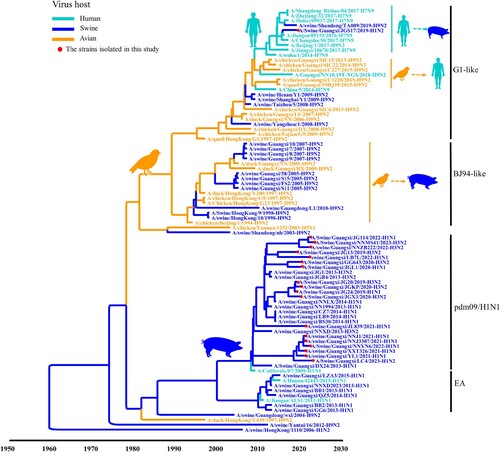
Figure 4. Phylogeny and divergence time of H1 HA genes. The phylogenetic tree of the H1 HA gene was generated by using the Bayesian MCMC framework, using the GTR substitution model with gamma-distributed among site rate heterogeneity and a “strict molecular clock” model. Coloured boxes show the lineage classification of the HA gene segments of IAVs. The isolates in this study are labelled with solid red circles. Blue and green solid circles indicate early isolated strains of Guangxi and EA H1N1 strains isolated from humans, respectively.
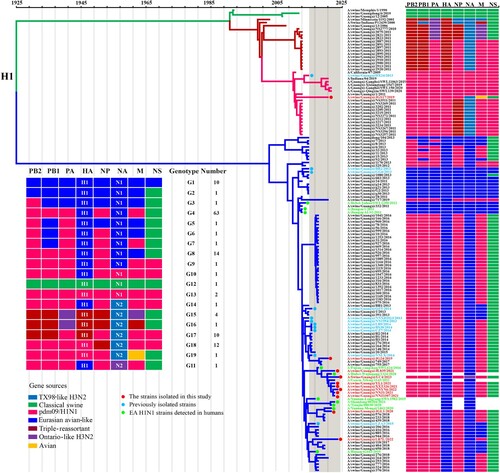
Figure 5. Phylogeny and divergence time of the H3 HA genes. The phylogenetic tree of the H3 HA gene was generated by the Bayesian MCMC framework, using the GTR substitution model with gamma-distributed among site rate heterogeneity and a “strict molecular clock” model. Coloured boxes show the lineage classification of HA gene segment of IAVs. The isolates in this study are labelled with solid red circles. Blue and green solid circles indicate early isolated strains of Guangxi and Ontario-like H3N2 strains isolated from humans, respectively.
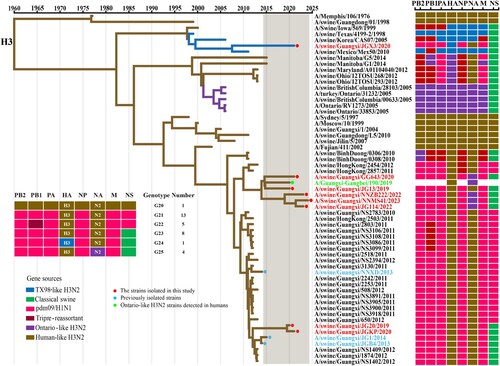
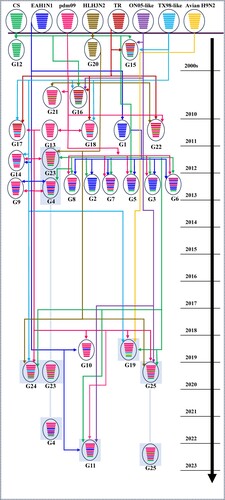
Figure 6. Genesis of the reassortant genotypes of SIVs that became established in pigs. Viral particles are represented by coloured oval shapes containing the lineage of origin (the colours of the lineage origin of segments are shown in (A)). The coloured long bars indicate the gene segments, from top to bottom, PB2, PB1, PA, HA, NP, NA, M and NS. The segments in the progeny viruses are coloured according to the source viruses (top). The arrows indicate the flow from the source virus of a gene segment (numbered at the arrow tails) to the receiving reassortant virus (arrowheads). The reassortant viruses in this study are shaded in grey. The timeline on the right indicates the year when the novel reassortant viruses were found.
Supplementary
Download MS Word (9.2 MB)Supplemental_Table_S2
Download MS Excel (61.3 KB)Data availability
Accessions with relevant swine influenza viruses obtained from GISAID and IRD are included in Supplementary Tables S2.