
Figures & data
Figure 1. Morphological characteristics and virulence of clinical isolate K. pneumoniae HSD. (a) Transmission electron microscopy (TEM) image of K. pneumoniae HSD with negative staining using methylamine tungstate. (b) TEM image of a transverse section of embedded K. pneumoniae HSD. (c) Colony morphology of K. pneumoniae HSD on Columbia blood agar. (d) Survival rates of G. mellonella infected with K. pneumoniae HSD and biofilm formation in K. pneumoniae HSD. Statistical analysis was performed using unpaired t-tests. ****, P < 0.0001.
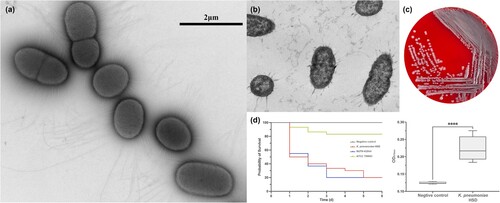
Table 1. Minimal inhibitory concentrations (MICs) of K. pneumoniae HSD, blaKPC-135-positive transformants, and recipient strains.
Figure 2. Structure and function of the β-lactamases KPC-135 and KPC-2 and their fitness costs. (a) Structure of KPC-2 (PDB ID: 3DW0) and KPC-135 enzyme (modelled by homology). The catalytic pockets of enzymes were depicted. (b) Kinetic parameters of purified KPC-2 (blue) and KPC-135 (yellow). The bar graph: MICs of blaKPC cloning strains are shown on the left vertical axis in base-2 logarithmic scale. The line graph: kcat/Km values of the enzymes were plotted on the right vertical axis. (c) IC50 of β-lactamase inhibitors against KPC-2 (blue) and KPC-135 (yellow). The bar graph: The reduced multiples of MICs of blaKPC cloning strains after addition of inhibitors to antibiotics are shown on the left vertical axis in base-2 logarithmic scale, with ceftazidime highlighted in blue. The line graph: The IC50 values were represented on the right vertical axis in an inverted base-10 logarithmic scale. (d) Relative fitness and (e) the bacterial growth curve of the K. pneumonia 13882-KPC-2 and 13882-KPC-135 cloning strains. Statistical analysis was performed using unpaired t-tests. ****, P < 0.0001.
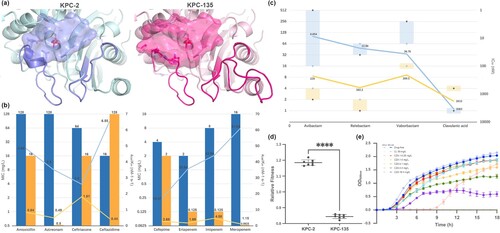
Figure 3. Comparative plasmid map of pK. pneumoniae HSD-KPC, p2b2, and p15WZ61-KPC. From the inside to the outside circles: circle 1, scale; circle 2, GC content; circle 3, GC Skew; circle 4, ring diagram of p15WZ61-KPC (GenBank accession number ON777848); circle 5, ring diagram of p2b2 (GenBank accession number CP034125); circle 6, functionally classified genes. MDR, blaKPC, and insertion regions of aligned sequences have been annotated.
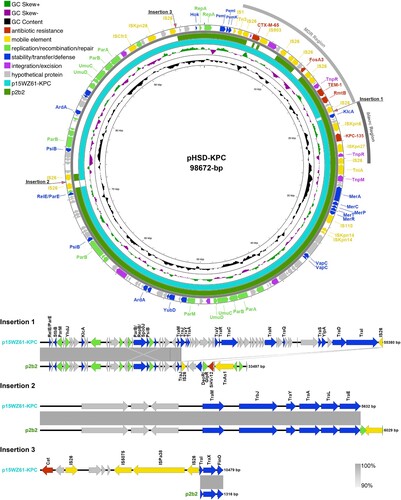
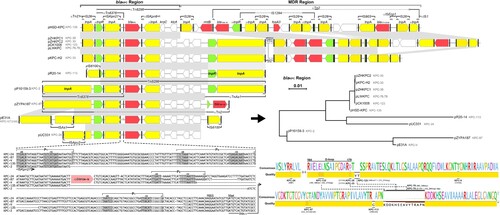
Figure 4. Genetic environment of Tn6296-associated blaKPC regions. Schematic structures of Tn6296 transposons surrounding the blaKPC-135 gene in plasmid pK. pneumoniae HSD-KPC are presented, along with a comparison to related genetic elements. Plasmids encoding KPC-2 mutants are compared as follows: pK. pneumoniae HSD-KPC (Anhui, China, OP205646), pZHKPC2 (Shanghai, China, OM928503), pLWKPC (Shanghai, China, MT875328 and MT550690), pZHKPC1 (Shanghai, China, OM928502), pCK1008-KPC-123 (Hangzhou, China, ON209376), pKPC-H2 (Shanghai, China, MT550691), pR20-14 (Hangzhou, China, CP094852), pP10159-3 (Chongqing, China, MF072963), pZYPA187 (Hangzhou, China, CP133754), pE31A (Jinan, China, CP067418), and pUC331 (Temuco, Chile, KR052099). The phylogenetic tree of the blaKPC region is constructed. Resistance genes are shown in red, resolvase genes (tnpR) in green, transposase genes (tnpA) in yellow, other genes in white, inverted repeat left (IRL) and inverted repeat right (IRR) in black boxes. Among them, the tnpA of IS26, the mutated tnpA of Tn2, and mutated tnpA and tnpR of TnAs1 are presented. Shading below the nucleotide sequences indicates nucleotide identity (grey: ≥ 99%, light grey: 85%−99%). Truncated and inserted sequences are represented by ellipses dots and triangles, respectively. Comparative analysis of the alignment of the (putative) promoter regions of blaKPC isoforms and the amino acids they encode. Highlighted regions include the putative – 35 and – 10 boxes of the promoters, the transcription start site (TSS, + 1), the putative ribosome binding site (RBS), the blaKPC gene start codon (ATG) and the truncated blaTEM-1B gene. The alignment quality of the KPC is based on Blosum62 scores.
Supplemental Material
Download PNG Image (976.6 KB)
Data availability statement
The genomic information of K. pneumoniae HSD has been deposited at DDBJ/ENA/GenBank under the accession number JBBVMI000000000, with the nucleotide sequence of blaKPC-135 deposited separately under accession number OP205646.1.