Figures & data

Figure 1. Features used for model training and selection. The model inputs included host, virus, and environment data. Host features were collected from electronic health records, virus features were collected using whole genome sequencing, and environmental features included the individual’s urban-rural classification based on their home ZIP Code. The model outcomes included hospital admission, ICU admission, long COVID, evaluated separately.
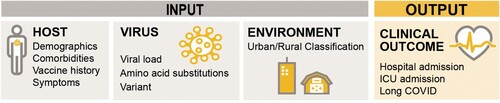
Table 1. Study population.
Figure 2. Statistical Analyses of Predictors. Evaluation of statistical associations between the selected predictive features and (A) hospitalization, (B) ICU admission, and (C) long COVID. Each dot represents the odds ratio, and each line represents the 95% confidence interval (CI) for each feature. Statistically significant associations are highlighted in red and defined as a 95% CI that does not overlap 1 (illustrated by the vertical dotted line). The left panel illustrates unadjusted odds ratios, and the right panel illustrates odds ratios adjusted for age, sex, and COVID-19 vaccination. ARDS, acute respiratory distress syndrome.
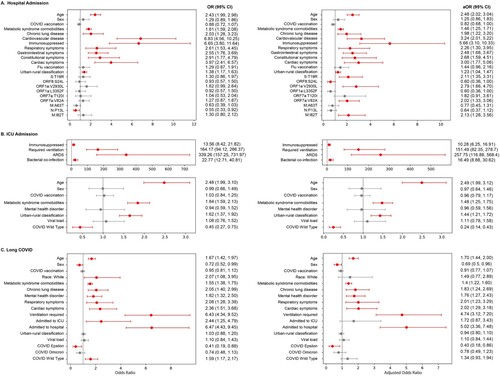
Table 2. Best performing model metrics.
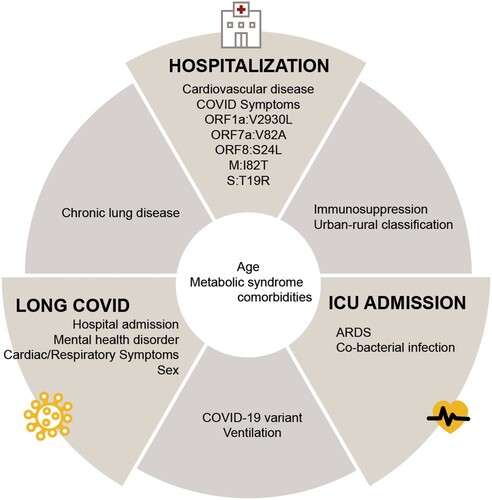
Figure 3. Significant predictors associated with disease outcomes. Features selected from the best-performing models for each outcome (hospitalization, ICU admission, and long COVID) were further analyzed using conventional logistic regression, and significant features were shown. Significant predictive features of multiple outcomes are shown between the respective outcome panels. ARDS, acute respiratory distress syndrome; Symptoms listed under hospitalization included gastrointestinal, constitutional, and cardiac symptoms.