
Figures & data
Figure 1. A simplified version of the phylogenetic tree of the HA genes of H9N2 viruses. The original phylogenetic tree based on the full-length HA sequences of 6,274 H9N2 AIV strains isolated from China was constructed by MEGA version 11 (http://www.megasoftware.net/) using a maximum-likelihood method with the Kimura 2-parameter model and 1,000 bootstrap replicates. For visualization, we randomly selected part of 6,274 H9N2 AIV strains to show a simplified version. The red squares represent standard strains in each branch of H9N2 viruses, whereas the coloured circles indicate representative strains of H9N2 viruses with different HA glycosylation patterns in the h9.4.2.5 branch. Bootstrap values >50% are shown at the branch nodes. The red squares on the tree represent the standard strains. The branches and sublineages are based on the nomenclature of Jiang et al. [Citation60] and Deng et al. [Citation61].
![Figure 1. A simplified version of the phylogenetic tree of the HA genes of H9N2 viruses. The original phylogenetic tree based on the full-length HA sequences of 6,274 H9N2 AIV strains isolated from China was constructed by MEGA version 11 (http://www.megasoftware.net/) using a maximum-likelihood method with the Kimura 2-parameter model and 1,000 bootstrap replicates. For visualization, we randomly selected part of 6,274 H9N2 AIV strains to show a simplified version. The red squares represent standard strains in each branch of H9N2 viruses, whereas the coloured circles indicate representative strains of H9N2 viruses with different HA glycosylation patterns in the h9.4.2.5 branch. Bootstrap values >50% are shown at the branch nodes. The red squares on the tree represent the standard strains. The branches and sublineages are based on the nomenclature of Jiang et al. [Citation60] and Deng et al. [Citation61].](/cms/asset/ff32fd16-7175-4fbb-9fc0-f386b46d5780/temi_a_2364736_f0001_oc.jpg)
Table 1. Analysis of the dominant branch of H9N2 viruses isolated in China during 1976–2022.
Figure 2. Statistics on the dominant HA glycosylation patterns of h9.4.2.5-branched H9N2 AIV strain during 2007–2022. The coloured rectangles represent different HA glycosylation patterns.
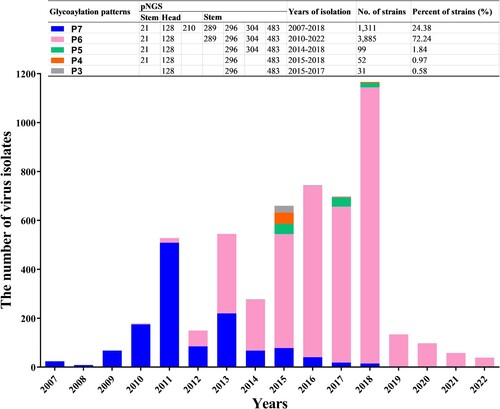
Figure 3. Glycosylation of non-conserved glycosylation sites at positions 210, 289, 304, and 21 identified by Western blotting. The five HA proteins with different glycosylation patterns that were treated without and with PNGase F are shown in lanes 1–5 and lanes 7–11. The marker in Lane 6 is 75 and 65 kDa from top to bottom.
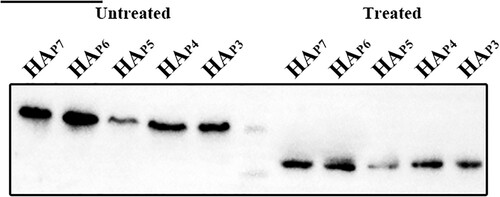
Figure 4. The receptor affinity of five virus mutants with different HA glycosylation patterns. (A) Twofold dilutions of 128 HAU of each virus were incubated at 4°C for 1 h with an equal volume of 0.5% chicken RBC. The samples were then transferred to 33°C, and the hemagglutination titres were measured at different time points. (B) 1% chicken RBCs were treated with twofold dilutions of RDE for 1 h, followed by an ice bath with an equal volume of 4 HAU virus for 45 min. The highest dilution of RDE that caused complete agglutination of RBCs was recorded. Each virus was incubated with 3′SLN (C) or 6′SLN (D) receptors to determine the receptor preference of HA. The significance of difference was analyzed by a Two-Way ANOVA test in GraphPad Prism 8.0.1 software. Each data point represents the mean ± SD of three independent experiments.
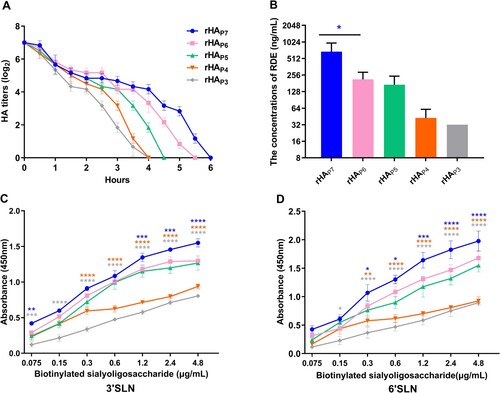
Figure 5. The antigenic map of five virus mutants with different HA glycosylation patterns. The 3 × 3 distance submatrix was extracted from the 5 × 5 distance matrix. The distance equation was then solved to compare the distances between any three viruses to obtain the x, y coordinates for the antigenic map.
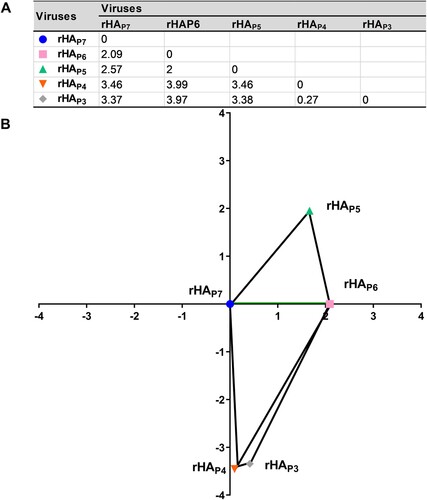
Figure 6. The stability of five virus mutants with different HA glycosylation patterns. (A) pH stability. 128 HAU/50 µL of virus was mixed with equal volumes of buffers (pH 4.0, 5.0, 6.0, and 7.0, respectively) and incubated at 37°C for 10 min. The sample was then assayed for hemagglutination titres. (B and C) Thermostability at 33°C and 37°C. 128 HAU/50 µL of virus was incubated at 33°C or 37°C for different time and then cooled to 4°C to determine the corresponding hemagglutination titres. Each data point represents the mean ± SD of three independent experiments.
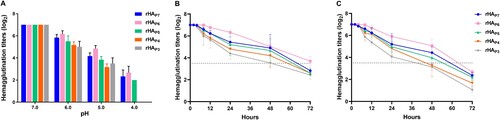
Figure 7. The growth kinetics of five virus mutants with different HA glycosylation patterns. CEF cells were infected with each virus at an MOI of 0.1 or 0.01, and cell supernatants were collected at different time points to determine the TCID50. One-step (A) and multi-step (B) viral growth kinetic curves were plotted. The significance of difference was analyzed by a Two-Way ANOVA test in GraphPad Prism 8.0.1 software. Each data point represents the mean ± SD of three independent experiments.
Data availability
All study data are included in the article and/or supplementary material.