
Figures & data
Figure 1. Classification of swine IAV into viral groups and subtypes according to their genetic constellation. Viral groups were obtained according to the genetic constellations of the gene segments and their combinations. Phylogenetic relationships were assessed by Maximum likelihood inference. The frequency of IAV viral group is shown within brackets. Complete genomes were only obtained for viral groups 1–4 (G1-G4). Incomplete genomes are illustrated as different viral group to avoid overestimation of any viral group. Blue: Pandemic origin; Yellow: Early classical swine origin; Purple: Human seasonal origin. Grey: Sequence information not obtained. First row indicates IAV gene segments HA: Hemagglutinin, NA: Neuraminidase, M: Matrix, NP: Nucleoprotein, NS: non-structural protein, PA: polymerase acidic, PB1: polymerase basic 1, PB2: polymerase basic 2.
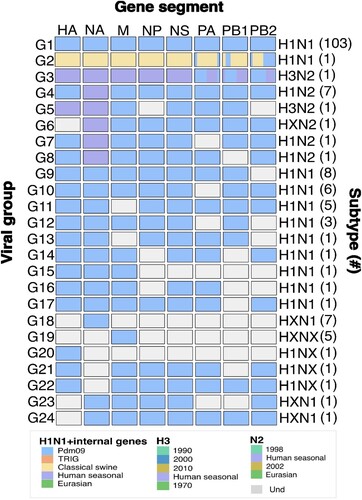
Table 1. Summary of the genetic constellations and subtypes of the swine influenza viruses originated from Colombia.
Figure 2. Recombination analysis of polymerases genes (PA, PB1 and PB2) of reassortant viruses from Colombia. Nucleotide pairwise identity (NPI) analysis was conducted using RDP4 programme using the RDP method. Other seven methods were also applied. Each chart represents the NPI between the sequences. The NPI is calculated as the percentage of nucleotides that are identical between the compared sequences, with values ranging from 0% (no identity) to 100% (complete identity). Left panel shows the results for H1N1-M1956, while the right panel shows results for H3N2-M10721. Analysis of the PA gene (A and B); PB1gene (C and D); and PB2 gene (E and F). The nucleotides positions of each recombined region are shown on X axis. Coloured bar at the top of each chart shows the recombined region and the parental virus strain. Detailed information of this analysis and results from the other recombination methods used are shown in SM (S15-22).
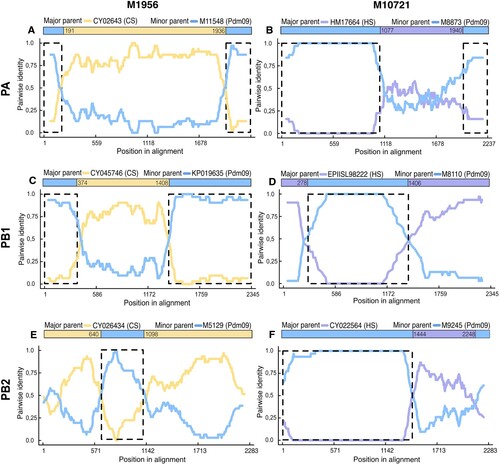
Figure 3. Frequency and spatial distribution of the swine influenza virus in Colombia. Pie charts indicate frequency of viral groups per location. Pie chart colours represent the viral groups according to the genetic constellations of IAV genomes. Values close to the pie charts are number of viruses analysed from that location.
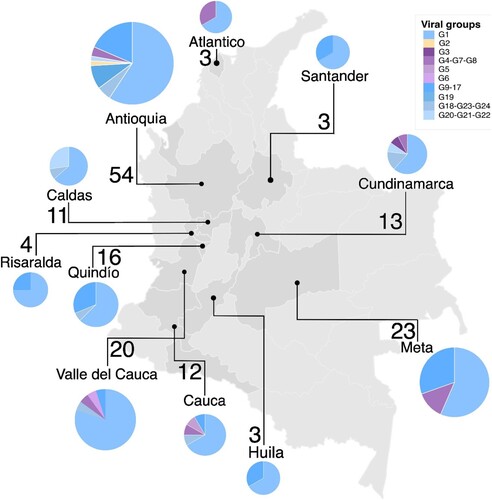
Figure 4. Bayesian phylogeny of HA (H1 and H3) and NA (N1 and N2) genes of swine IAV in Colombia. Phylogenetic relationships inferred using Bayesian analysis. Each branch is coloured according to the ancestral lineage. Trees were constructed using Beast programme by Bayesian Markov-Chain Monte Carlo with >100,000,000 generations. Red circles represent sequences from this study. Collapsed trees are illustrated here, an extended and more detailed versions are available in supplementary material.
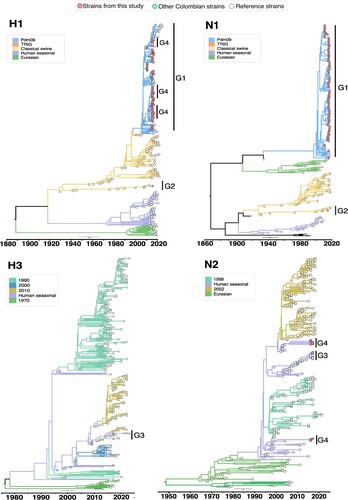
Figure 5. Bayesian phylogeny of internal genes of swine IAV in Colombia. Phylogenetic relationships inferred using Bayesian analysis. Each branch is coloured according to the ancestral lineage. Trees were constructed using Beast programme by Bayesian Markov-Chain Monte Carlo with >100,000,000 generations. Sequences from this study are represented with red circles. Collapsed trees are illustrated here, an extended and more detailed versions are available in supplementary material.
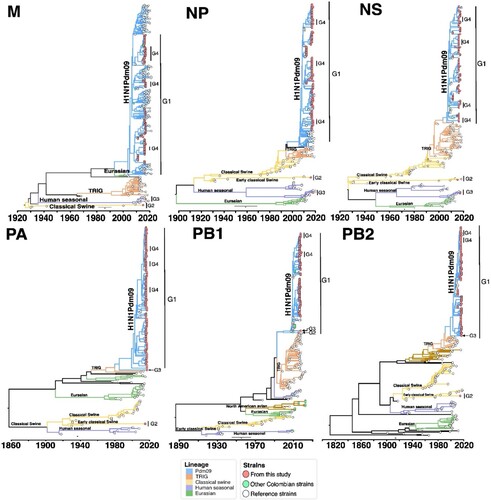
Table 2. Comparison of antigenic motifs and antigenic phenotypes of H3 Influenza A viruses originated from Colombia.