Figures & data
Figure 1. VACV N2 and MPXV P2 have the strongest ability to antagonize IFNB1 expression among Bcl-2-like proteins. (A) Amino acid analysis of Bcl-2-like protein orthologues of VACV-WR strain. Neighbour joining phylogenetic trees for poxvirus full-length coding sequences were constructed using Neighbour-joining (NJ) method in MEGA 6.0 with bootstrap value set to 1000. Asterisks (∗) indicate insertions and Asterisks (†) indicate codon deletions. N and C represent the N and C terminus, respectively. The number 1 indicates that the protein is present, while the number 0 indicates the absence of the protein. (B) Luciferase activity of lysates in HeLa cells transfected with IFN-β luciferase reporter (IFN-β-Luc) and Bcl-2-like proteins of VACV-WR or vector plasmid for 24 h, then infected with HSV-1 at MOI = 1.0 for 6 h. (C) Luciferase activity of lysates of HeLa cells that had been transfected with IFN-β luciferase reporter (IFN-β-Luc) and Bcl-2-like proteins of MPXV or vector plasmid for 24 h, then infected with HSV-1 at MOI = 1.0 for 6 h. Immunoblot analysis of the expression of each Bcl-2-like protein were shown under each bar chart. Data are shown as mean ± SD. ***P < 0.001 (One-way ANOVA followed by Dunnett’s test, vector and virus treatments as a control for multiple comparisons).
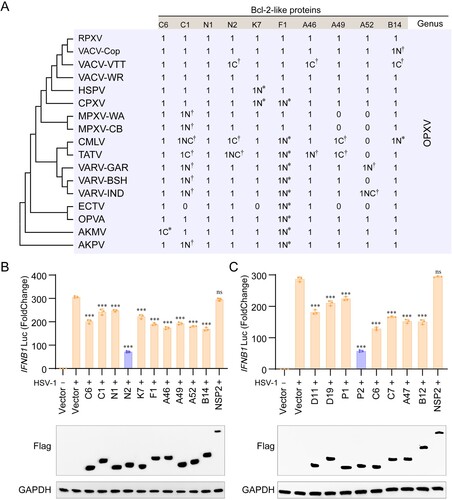
Figure 2. OPXV P2 protein orthologues with partial or complete loss of NLS lose the ability to translocate into the nucleus and to inhibit host innate immunity. (A) Neighbour-joining phylogenetic tree based on the MPXV P2 full length aa sequence and constructed using MEGA 6.0 with bootstrap value set to 1000 (left). The NLS aa sequence alignments of P2 orthologues in OPXVs by DNAMAN software (middle). The aa sequence homology of OPXVs compared with MPXV-CB-P2 (right). (B) The localization of P2 orthologues were determined by immunofluorescence microscopy in HEK293 T cells transfected with GFP-tagged P2 orthologue or GFP-Vector plasmid for 24 h. The nuclei were stained with DAPI. Scale bar: 3 µm. (C) mRNA levels of IFNB1 and ISG20 were determined by RT-q-PCR in HeLa cells transfected with GFP-tagged P2 orthologue or GFP-Vector plasmid for 24 h, and then stimulated with cGAMP for 6 h. Immunoblot analysis of the expression of P2 orthologues were shown under the bar chart. Data are shown as mean ± SD. ***P < 0.001 (One-way ANOVA followed by Dunnett’s test).
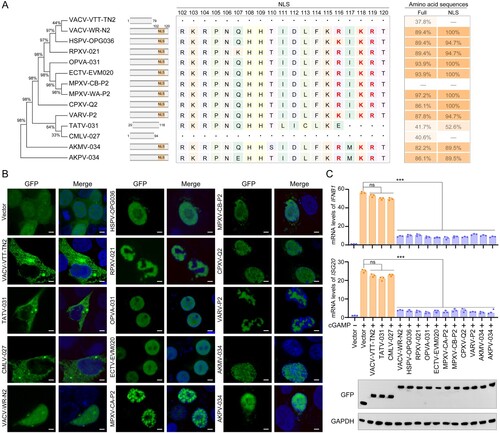
Figure 3. MPXV P2 antagonizes IRF3 nuclear translocation and innate immunity. (A–C) The mRNA levels of IFNB1 (a), ISG15 (b), and ISG20 (c) were determined by RT-q-PCR in HeLa cells transfected with Myc-P2 or Myc-vector plasmid, along with cGAMP, cGAS, STING1, TBK1, or IRF3-5D plasmid for 24 h. (D) The levels of cGAS, STING, TBK1, and IRF3 were detected by immunoblotting in HeLa cells co-transfected with Myc-P2 or Myc-Vector (top). Band intensities were determined by ImageJ software (bottom). (E) The phosphorylation levels of TBK1 and IRF3 were determined by immunoblotting in HEK293 T cells co-transfected with stimulator plasmids Flag-cGAS and His-STING, along with Myc-P2-expressing plasmid or Myc-vector for 24 h (left). Band intensities were determined by ImageJ software (right). (F) The dimerization of IRF3 was determined by immunoblotting in HEK293 T cells co-transfected with stimulator plasmids Myc-IRF3-5D, along with Flag-P2-expressing plasmid or Myc-vector for 24 h. (G) The localization of IRF3 was determined by immunofluorescence microscopy in HEK293 T cells co-transfected with stimulator plasmids Myc-IRF3-5D, along with Flag-P2-expressing plasmid or Flag-vector for 24 h (left), and the translocation percentage was calculated by dividing the number of cells with nuclear Myc-IRF3 by the total number of Myc-positive cells (right). The nuclei were stained with DAPI. Scale bar: 5 µm. Data are shown as mean ± SD. ***P < 0.001 (Multiple t-tests).
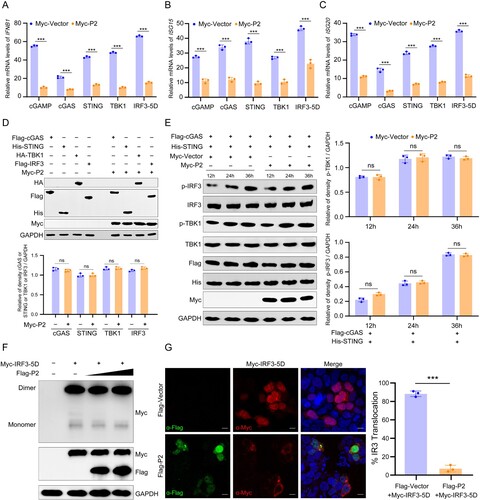
Figure 4. KPNA2 mediates the translocation of MPXV P2 into the nucleus. (A) The localization of P2 was determined by immunofluorescence microscopy in HEK293 T cells treated with DMSO, ivermectin, or importazole for 6 h, then transfected with pEGFP-P2 plasmids for another 24 h. The nuclei were stained with DAPI. Scale bar: 3 µm. (B) Images of silver-stained gel of immunoprecipitated proteins using P2 as bait. HEK293 T cells were transfected with a plasmid expressing GFP-P2 fusion protein for 24 h, following by immunoprecipitation (IP) using antibodies against GFP. Samples were subjected to SDS-PAGE and visualized by silver staining. (C) Immunoblot analysis of lysates from HEK293 T cells co-transfected with Myc-P2 and Flag-KPNAs (KPNA1-6) or KPNB1 for 24 h, followed by immunoprecipitation with indicated antibodies. (D) Immunoblot analysis of lysates from BSC-1 cells infected by VACV-WR (MOI = 0.1) for 48 h, followed by immunoprecipitation with indicated antibodies. (E) The interaction between P2 and KPNA2 was determined by GST pull-down assay. Escherichia coli (BL21) expressed His-tagged P2 and GST-tagged KPNA2 recombinant proteins were purified, and protein-protein interactions were examined by GST-mediated pull-down assay, followed by immunoblotting with anti-His and GST antibodies. (F) Structure prediction of P2 viewed from the front and back view (rotated 180 degrees) using AlphaFold2. The NLS region is shown in silver. (G) Molecular docking of the interaction between P2 (silver) and KPNA2 (brown, PDB code: 4WV6). (H) The cellular localization of P2 was detected by nuclear-cytoplasmic separation assay in HEK293 T cells co-transfected with Myc-P2 and siRNA-KPNA2 or siRNA-NC plasmids. (I) The localization of P2 was determined by immunofluorescence microscopy in HEK293 T cells transfected with control siRNA or KPNA2 siRNA for 24 h, then transfected with pEGFP-P2 plasmids for another 24 h. The nuclei were stained with DAPI. Scale bar: 3 µm. (J) The localization of P2 was determined by immunofluorescence microscopy in HEK293 T cells treated with ivermectin for 6 h, then transfected with GFP-P2 plasmids and Flag-KPNA2 plasmids for another 24 h. The nuclei were stained with DAPI. Scale bar: 3 µm. Data are shown as mean ± SD.
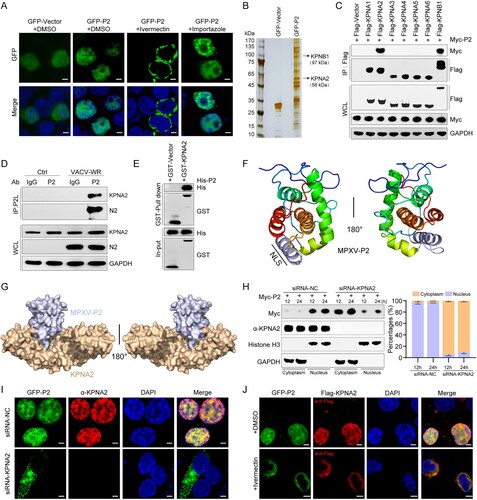
Figure 5. Two-dimensional and three-dimensional structure interaction diagram for P2-KPNA2 (PDB code: 4WV6) (A, B) and IRF3 (PDB code: 2PI0)-KPNA2 (PDB code: 4WV6) (C, D) were created using LigPlot (https://www.ebi.ac.uk/thornton-srv/software/LIGPLOT/) and PyMol software (http://www.pymol.org), displaying the details of the interacting aa, bridging water molecules and hydrogen bond distances. (E) A nucleocytoplasmic fractionation experiment was performed in HEK293 T cells transfected with GFP-P2-WT, GFP-P2-ΔNLS, GFP-P2-Mut, or GFP-Vector for 24 h, followed by immunoblot analysis. Antibodies against GAPDH or histone H3 were used to mark cytosolic or nuclear fractions, respectively. (F) Immunoblot analysis of lysates from HEK293 T cells co-transfected with Flag-KPNA2 plasmid and GFP-P2-WT, GFP-P2-ΔNLS, GFP-P2-Mut, or GFP-Vector plasmid for 24 h, followed by immunoprecipitation with indicated antibodies. (G) The localization of IRF3 was determined by immunofluorescence microscopy in HEK293 T cells co-transfected with stimulator plasmids Myc-IRF3-5D, along with HA-P2-WT, HA-P2-ΔNLS, HA-P2-Mut expressing plasmid or HA-vector, for 24 h. The nuclei were stained with DAPI. Scale bar: 3 µm. (H) Immunoblot analysis of lysates from HEK293 T cells co-transfected with Flag-KPNA2 and Myc-IRF3-5D plasmids, along with HA-P2-WT, HA-P2-ΔNLS, HA-P2-Mut, or HA-Vector plasmid for 24 h, followed by immunoprecipitation with indicated antibodies. (I) Immunoblot analysis of lysates from HEK293 T cells co-transfected with Flag-KPNA2 and Myc-IRF3-5D plasmids, along with HA-VACV-WR-N2, HA-ECTV-EMV020, HA-VACV-VTT-TN2, HA-VACV-VTT-TN2+NLS, or HA-Vector plasmid for 24 h, followed by immunoprecipitation with indicated antibodies. (J) The mRNA levels of IFNB1 and ISG20 were determined by RT-qPCR in HEK293 T cells co-transfected with HA-P2-WT, different doses of Flag-KPNA2 plasmid (0.5, 1.0, or 2.0 ug) for 24 h, and then stimulated with cGAMP for 6 h. Scale bar: 5 µm. The experiments (h and i) were repeated three times and Image J software was used for the grey value analysis. Vector treatment as a control for multiple comparisons. Data are shown as mean or mean ± SD. ***P < 0.001 (One-way ANOVA followed by Dunnett’s test).
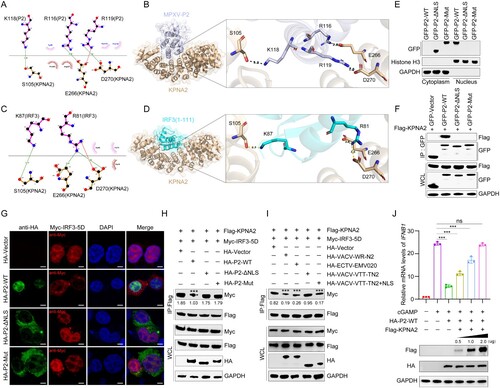
Figure 6. Protein P2 inhibits innate immune activation to facilitate viral replication. (A–C) The mRNA levels of IFNB1 (a), ISG15 (b), and ISG20 (c) were determined by RT-qPCR in HeLa cells transfected with HA-P2-WT, HA-P2-ΔNLS, HA-P2-Mut, or HA-vector plasmid for 24 h, and then stimulated with VACV-WR (MOI = 0.1) for 12 h. (D) Immunoblot analysis of VACV-WR-A35 in HeLa cells transfected with different dose of HA-P2 WT or HA-Vector plasmid for 24 h, followed by infection with VACV-WR (MOI = 0.1) for 24 h (top). Band intensities were determined by ImageJ software (bottom). (E–G) HeLa cells were transfected with HA-P2-WT, HA-P2-ΔNLS, HA-P2-Mut, or HA-vector plasmid for 24 h, followed by infection with VACV-WR (MOI = 0.1) for 24 h. The protein levels of VACV-WR-A35 were measured by immunoblotting (e, top). Band intensities were determined by ImageJ software (e, bottom). The mRNA levels of VACV-WR-A35R were measured by RT-qPCR (F). Infectious viral titers were obtained by plaque assays from the collected supernatant (G). Data are shown as mean ± SD. **P < 0.01 and ***P < 0.001 (One-way ANOVA followed by Dunnett’s test).
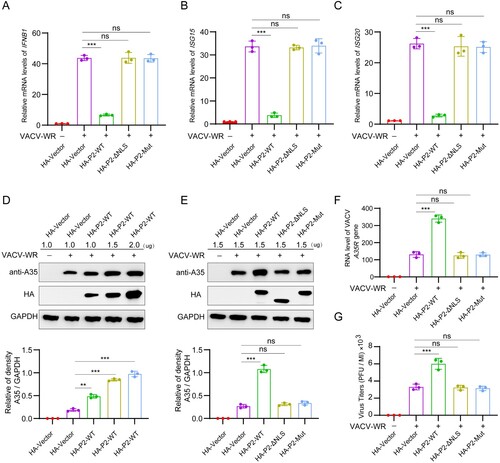
Figure 7. Deletion of NLS from the P2 orthologue (N2) in VACV-WR attenuates viral replication and virulence. (A) The NLS deletion strategy of the N2L gene in VACV-WR: the N2L gene in the VACV-WR genome was replaced with EGFP-N2L-ΔNLS via homologous recombination. (B) The mRNA levels of IFNB1, ISG15, ISG20, MX1, MX2, and IFIT1 were determined by RT-qPCR in HeLa cells infected with VACV-WT or VACV-N2L-ΔNLS (MOI = 0.1) for 12 h. (C) Virus titers were determined in HeLa cells infected with VACV-WT or VACV-N2L-ΔNLS (MOI = 0.1) for the indicated times by plaque assay. (D) Virus titers were determined in Vero-E6 cells infected with VACV-WT or VACV-N2L-ΔNLS (MOI = 0.1) for the indicated times by plaque assay. (E) Immunoblotting analysis of VACV-WR-A35 in HeLa cells infected with VACV-WT or VACV-N2L-ΔNLS (MOI = 0.1) for 24 or 48 h (left). Band intensities were determined by ImageJ software (right). (F) Virus titers were determined in HeLa cells transfected with Myc-N2 or Myc-vector plasmid for 24 h, followed by infection with VACV-WT (MOI = 0.1) or VACV-N2L-ΔNLS for the indicated times by plaque assay. (G) Schematic illustration of the experiment to measure the virulence of VACV-WT and VACV-N2L-ΔNLS in mice. Briefly, groups of mice were infected with VACV-WT or VACV-N2L-ΔNLS (5 × 10⁶ PFU) by intraperitoneal infection, and the body weight changes and clinical observations of the mice were monitored for 20 days (n = 10). On the d 6 post infection, mice were euthanized and the lungs, spleen, and liver were collected for further detection (n = 5). (H, I) Body weight changes (h) and survival rate (i) of mice after virus infection. (J) The mRNA levels of Ifnb1, Isg15, Isg20, Mx1, Mx2, and Ifit1 in lungs of virus-infected mice were detected by RT-qPCR at d 6 post infection. GAPDH expression was used as a normalizer. (K) RT-qPCR analysis of VACV A35R mRNA expression in lungs, spleens, and livers of virus-infected mice. GAPDH expression was used as a normalizer. (L) Infectious viral titers in lungs, spleens, and livers of virus-infected mice were determined by plaque assay. (M) Quantitative analysis of the number of VACV-WR-positive cells in spleen of virus-infected mice by immunohistochemistry staining with anti-A35 antibody. Scale bar: 30 µm. (N) H&E staining image of mouse lungs of virus-infected mice. The severity of pathological manifestations was scored from 0 to 4 with 0 for no damage and four for the maximum damage. Scale bar: 30 µm. Data are shown as mean ± SD. ***P < 0.001; Multiple t-tests for (e, k, and l), two-tailed Student’s t-test for (m and n), one-way repeated measurement analysis of variance (RMANOVA) for (c, f, and h), and log rank test for (i).
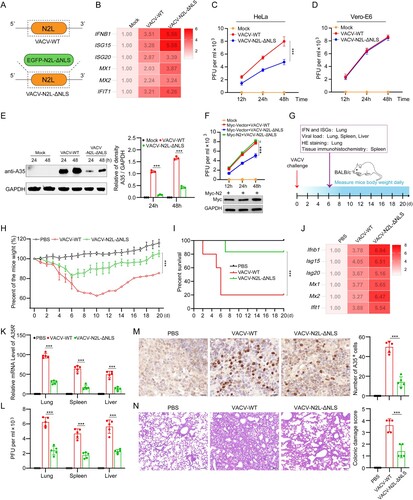
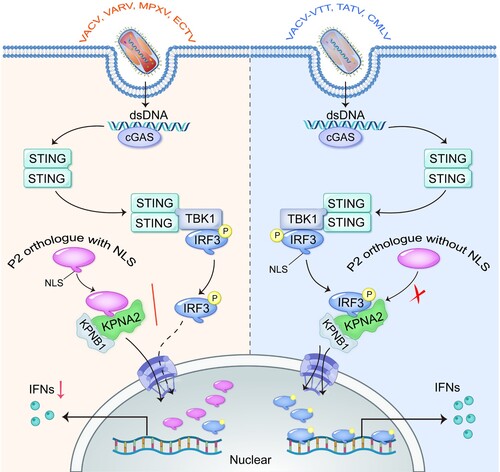
Figure 8. The NLS of MPXV P2 orthologue hijacks KPNA2 to inhibit the nuclear import of IRF3. Upon OPXV infection, the cGAS-STING signalling pathway is activated. The NLS of P2 or homologous protein (such as from VACV, VARV, MPXV and ECTV) interacts with KPNA2, which inhibits KPNA2-mediated IRF3 nuclear import, leading to reduced transcription of IRF3-dependent genes. However, the P2 proteins lacking an NLS (such as from VACV-VTT, TATV, and CMLV) do not block the nuclear localization of IRF3.