Figures & data
Table 1. Comparison of main characteristic of N2 and SF6.
Figure 1. Schematic diagram of the test rig.
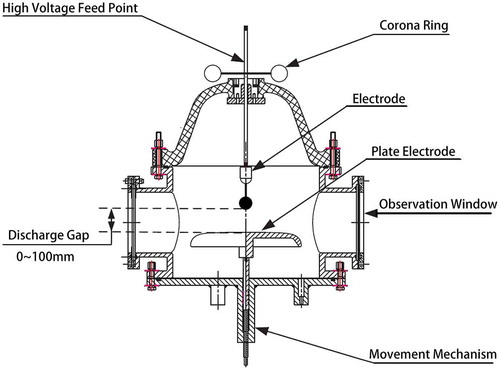
Table 2. Non-uniform coefficient for electric field at different gap distance.
Table 3. Moisture content of N2.
Figure 2. H2O saturated steam pressure curve [Citation15].
![Figure 2. H2O saturated steam pressure curve [Citation15].](/cms/asset/d19e0a8a-9205-4b00-b782-334cea8f90fd/tjee_a_1471864_f0002_b.gif)
Figure 3. Breakdown characteristics of N2 in the condition of different moisture content under lightning impulse (Li−).
Figure 4. Breakdown characteristics of N2 in the condition of different moisture content under lightning impulse (Li+).
Figure 5. Breakdown voltage of N2 with different moisture content.