
Figures & data
Table 1. Demographic features of Chukotka Autonomous Okrug and Yakutia Republic, 2015 (adapted from [Citation9,Citation10]).
Figure 1. Map of eastern Russia (open access), showing the location of the Yakutia Republic and Chukotka Autonomous Okrug.
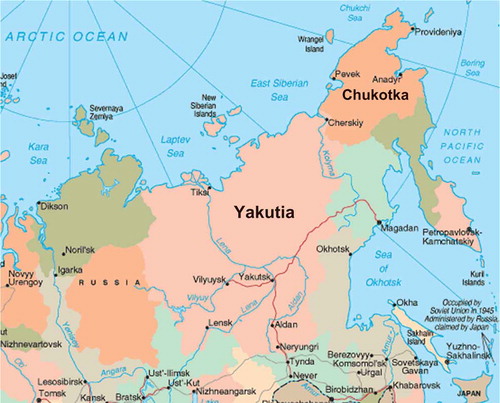
Figure 2. Water supply and sewerage in Chukotka and Yakutia, % of inhabited localities, 2014–2016 (created using [Citation11,12,Citation17]).
![Figure 2. Water supply and sewerage in Chukotka and Yakutia, % of inhabited localities, 2014–2016 (created using [Citation11,12,Citation17]).](/cms/asset/76a0775d-d962-42d5-b17d-f07358fabb2e/zich_a_1423826_f0002_c.jpg)
Table 2. Number and share of inhabited localities with water pipe and sewerage in Yakutia (adapted from [Citation12]).
Table 3. Characteristics of housing water supply and sanitation in Yakutia, 2015 (adapted from [Citation13]).
Table 4. Share of housing in the cities with centralised in-home sewerage, Yakutia – 2013 (from [Citation14]).