
Figures & data
Figure 1. Map of Greenland showing the six selected town regions for the ACCEPT sub-study in 2010-11. Participants were enrolled in Qaanaaq, Ilulissat, Aasiaat, Maniitsoq, Nuuk, and Paamiut [Citation18, Citation19].
![Figure 1. Map of Greenland showing the six selected town regions for the ACCEPT sub-study in 2010-11. Participants were enrolled in Qaanaaq, Ilulissat, Aasiaat, Maniitsoq, Nuuk, and Paamiut [Citation18, Citation19].](/cms/asset/a961f3e8-1a95-4120-a35e-518297130b05/zich_a_1456303_f0001_c.jpg)
Figure 2. The total number (N = 189) of participants’ data stratified by gestation week and trimester groups at inclusion time.
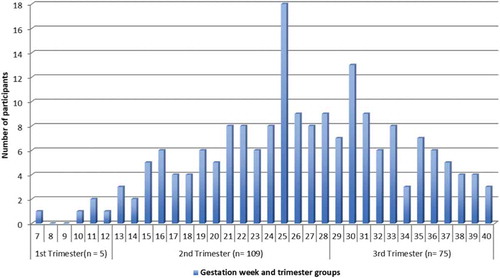
Table 1. Baseline characteristics for study population (N = 189).
Table 2. Baseline information of the haematological markers for the study population (N = 189).
Table 3. The association between haematological markers and serum level of sumPCBs (N = 189).
Table 4. The association between haematological markers and serum level of sumOCPs (N = 189).
Table 5. The association between haematological markers and serum level of sumPFASs (N = 189).
