Figures & data
Figure 1. Percentage that answered “yes” at the question: “Are you usually afraid or worried/sad/lonely/angry?” Total and by gender. N = 83–86
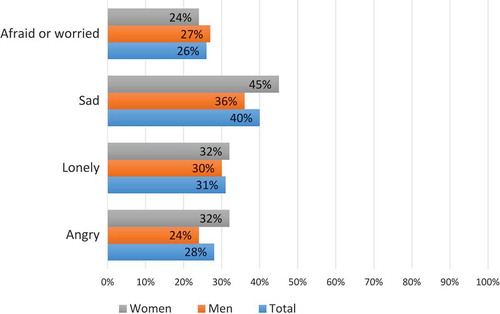
Figure 2. Percentage that answered “yes” at the question: “Are you usually afraid or worried/sad/lonely/angry?” By ethnicity (Sami background or not). N = 74–76
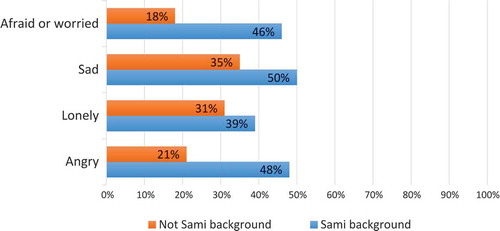
Figure 3. Percentage that answered “yes” at the question: “Have you during the last year experienced that someone has said unpleasant things to you/teased you/threatened to hurt you/hurt you?” Total and by gender. N = 81–83
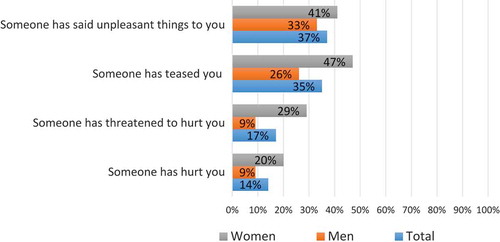
Figure 4. Percentage that answered “yes” at the question: “Have you during the last year experienced that someone has said unpleasant things to you/teased you/threatened to hurt you/hurt you?” By ethnicity (Sami background or not). N = 47 (Sami background) and N = 27 (not Sami background)
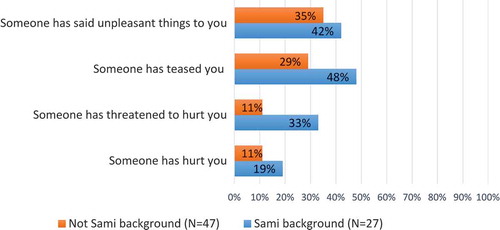
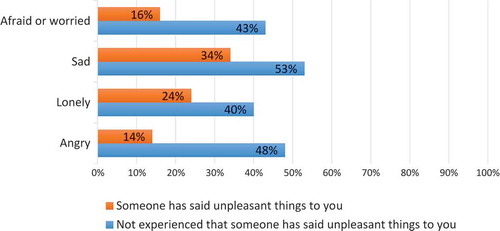
Figure 5. Percentage that answered “yes” at the question: “Are you usually afraid or worried/sad/lonely/angry?” By whether the respondents during the last year have experienced that someone has said unpleasant things to them or not. N = 78–80