
Figures & data
Figure 1. Map of Greenland with study areas marked
Figure 2. Flowchart of participants
Table 1. Characteristics of children included in the study
Figure 3. Traditional Greenlandic food consumption by area. Information about diet was not available for children from Sisimiut, Aasiaat and Qasigiannguit
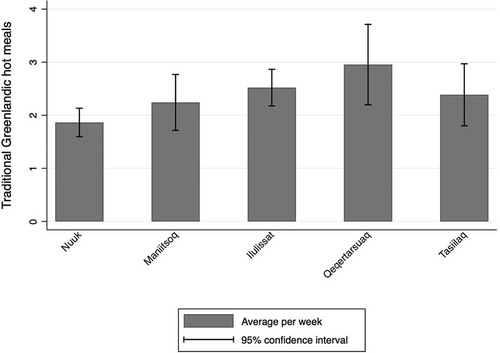
Table 2. Pearson’s correlation coefficients for the log-transformed environmental exposures
Table 3. Per cent difference in mercury, ΣPCB, and PFASs with potential predictors. For total numbers in subgroups see
Table 4. Per cent difference in mercury, ΣPCB, and PFASs with potential predictors – adjusted for area of residence. For total numbers in subgroups see
Table 5. Explanatory power for models containing different sets of predictors using all cases and complete cases