Figures & data
Figure 1. Data on the spread of natural focal infections of bacterial and viral aetiology on the territory of the Republic of Sakha (Yakutia)
Figure 2. Statistics on the prevalence of zoonotic diseases (individual cases of new infections) in the Republic of Sakha
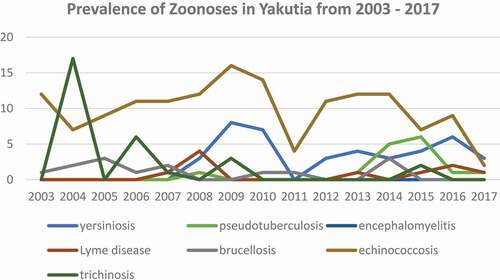
Table 1. Statistics on the prevalence of selected zoonotic diseases (individual cases of new infections) in the Republic of Sakha from 1950–2018
Table 2. Risk zones for anthrax outbreaks and degree of disadvantage according to Neustroev and Dyagilev [unpublished work]
Table 3. Statistics on the prevalence of selected zoonotic diseases in horses in the Republic of Sakha. 1 – number of disadvantaged farms, 2 – number of animals diseased, n.d.a. – no data available (Neustroev et al. 2018a)
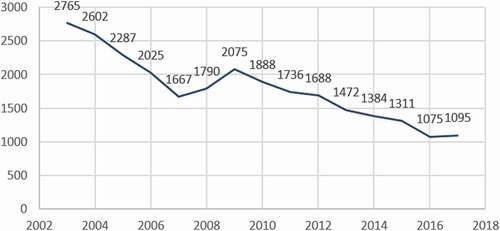
Figure 3. Prevalence of Diphyllobothriasis in Yakutia from 2003–2017 (individual cases)