
Figures & data
Figure 1. Map of study area of the survey From Rural to Urban Living, 2014. The figure shows the included places of origin (municipalities at the age of 15) and cities where participants currently live. The figure is designed for this paper by the main author and is used with permission from the Centre for Sami Health Research at UiT The Arctic University of Norway.
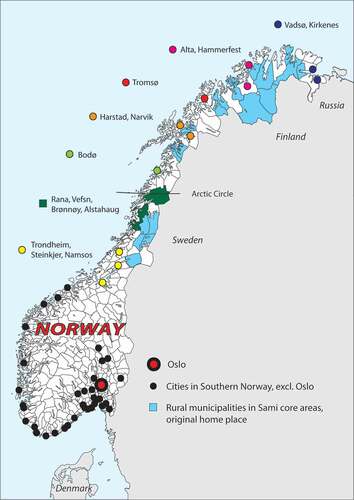
Table 1. Participation of first-generation internal migrants, by sex, age group and city region. The survey From Rural to Urban Living, 2014 (N = 6176 invitees and n = 1996 participants).
Table 2. Characteristics of first-generation internal migrants, by early, median, late and no-response and median number of days to respond. The survey From Rural to Urban Living, 2014 (n = 1996).
Table 3. Characteristics of first-generation internal migrants, by sex and age group. The survey From Rural to Urban Living, 2014 (n = 1996).
Table 4. Participation of second-generation internal migrants, by sex, age group, and geographic region. The survey From Rural to Urban Living, 2014 (N = 6433 invitees and n = 1144 participants).
Table 5. Characteristics of second-generation internal migrants, by sex and age group. The survey From Rural to Urban Living, 2014 (n = 1144).