
Figures & data
Figure 1. Fort Albany First Nation, James Bay, Ontario, Canada.
Table 1. Summary of black carbon mass concentration data collection.
Figure 2. Clockwise from top left: Figure 2(a). Geese being smoked over a fire in a traditional game-smoking tent. Smoke is clearly visible towards the top of the photo. Figure 2(b). A wood burning wood stove made of a steel 45-gallon drum in a hunting cabin. Figure 2(c). A chimney flue exiting a hunting cabin. Photo permissions: R. Moriarity (2a) and M.Wilton (2b and c).
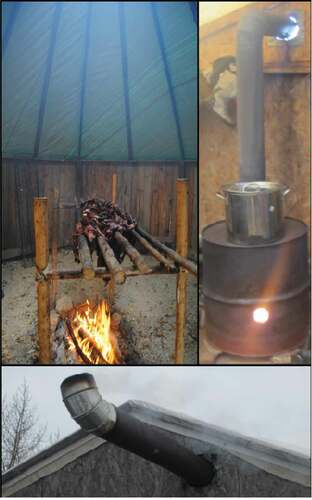
Table 2. Black carbon mass concentrations in game-smoking tents and hunting cabins.
Figure 3. Wood smoke BC mass concentration boxplots. Mass concentrations of BC (log10 µg m−3) of the game-smoking tent (TCA1) and the hunting cabins (TCA2) with seasonal or site means (red circle). The width of the boxes varies by sample size, where a larger box represents a larger sample size and vice versa.
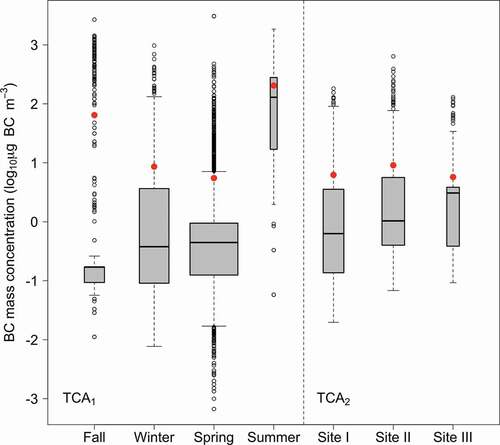
Figure 4. Wood smoke BC mass concentrations during TCA1. Non-consecutive time-series plot of mass concentrations of BC over the seasonal data collection periods in the game-smoking tent. The change in season is noted by the break in the axis. The seasonally adjusted data (blue line) and moving average (dashed red line) are included to indicate the trend of the data.
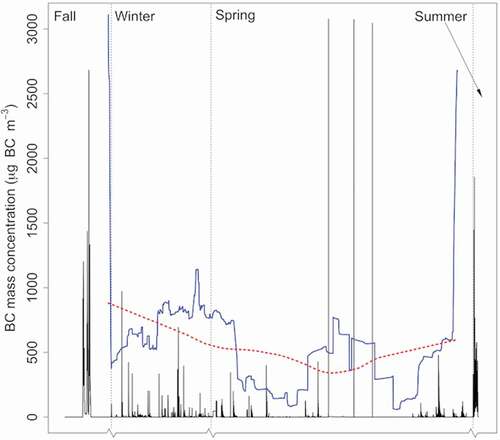
Figure 5. Wood smoke BC mass concentrations during TCA2. Time-series plot of mass concentrations of BC over the period from April 17 to 25, 2016 at site I (top plot), site II (middle plot) and site III (bottom plot). The propane interventions at site I are noted by the red dashed-line boxes.
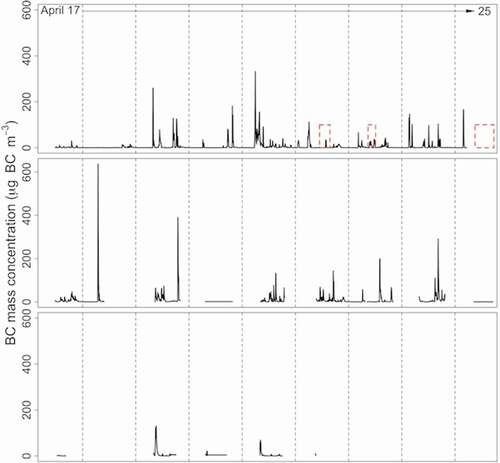
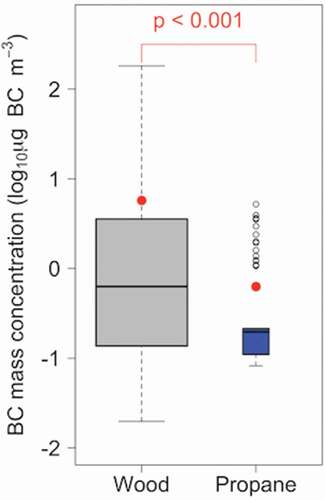
Figure 6. Wood smoke BC mass concentrations boxplots before and during propane intervention (TCA2i). Mass concentrations of BC (log10 µg m−3) in hunting cabin site I while burning wood for heat (grey box) and when the propane-fuelled heater was introduced (blue box). The mean BC mass concentrations are indicated by a red circle. Sample size varies by width of box.
Data availability
The data that support the findings of this study are retained with the corresponding author, Robert J. Moriarity. The data are not publicly available because it contains information that could compromise the privacy of research participants.