Figures & data
Figure 1. Study area
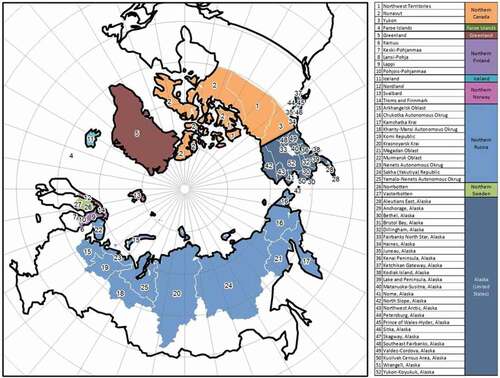
Table 1. COVID-19 Pandemic in the Arctic regions on 1 July 2020
Figure 2. Cumulative cases of COVID-19 in the Arctic, February-July 2020
Figure 3. Reported confirmed cases (solid lines) and deaths (dashed lines) per 100,000 by region (seven day average). Greenland, Faroe Islands and Northern Canada had no fatalities. Finland reports fatalities using different spatial units than cases, so they are not illustrated
Figure 4. Dynamics of COVID-19 CFR by region
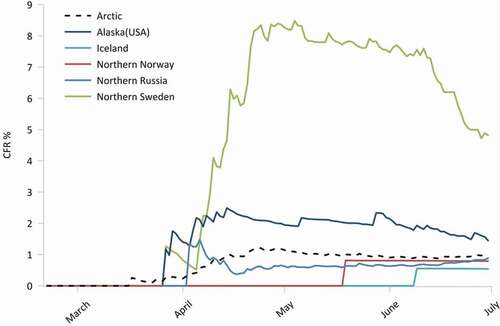
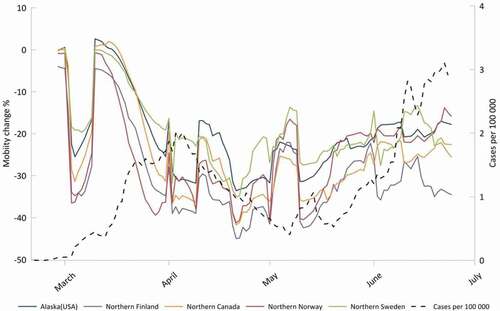
Figure 5. Workplace mobility change and COVID-19 incidence rate by region and overall cases per 100,000 in the Arctic