Figures & data
Table 1. MercuNorth study details and participant characteristics
Table 2. Blood Hg concentrations in pregnant women by study regions from 2010 to 2016
Figure 1. Distribution of blood Hg concentrations in participants from each study region
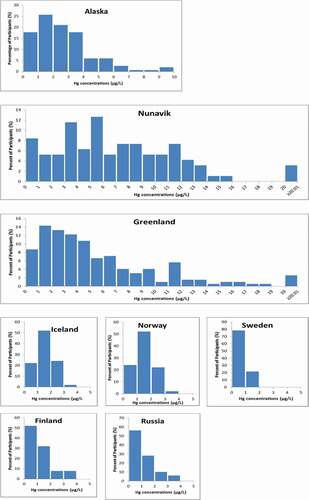
Table 3. Pairwise comparison of geometric means between study regions (p-values)
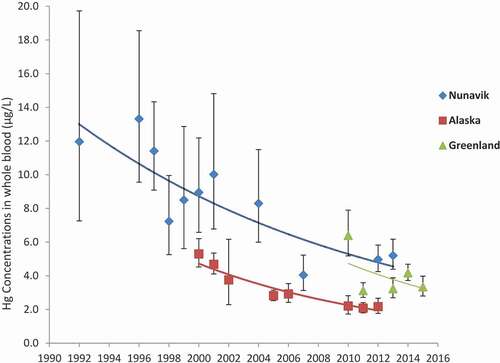
Figure 2. Temporal trend of geometric mean Hg concentrations (μg/L) in whole blood of pregnant women from Nunavik, (1992–2013), Alaska (2000–2012) and Greenland (2010–2015). Error bars represent the GM 95% confidence interval