Figures & data
Figure 1. Flow diagram of the study selection process
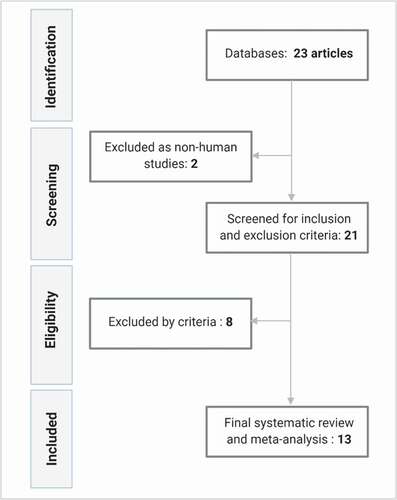
Figure 2. Antarctic bases of eligible studies. Referential map about locations of Antarctic bases and stations involved in studies included in the systematic review and meta-analysis
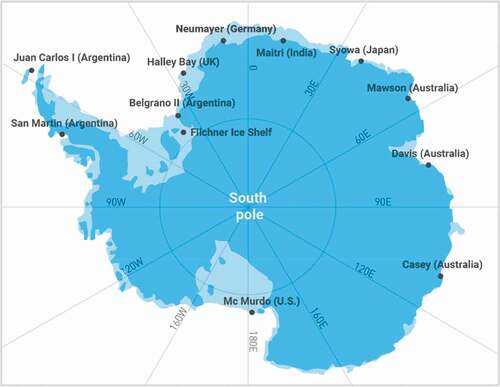
Table 1. Summary of findings. Characteristics of studies included in the systematic review and meta-analysis involved in 25(OH)D status
Table 2. Summary of findings of studies evaluating the effect of VD supplementation on VD status
Figure 3. Assessment of risk of bias in included studies
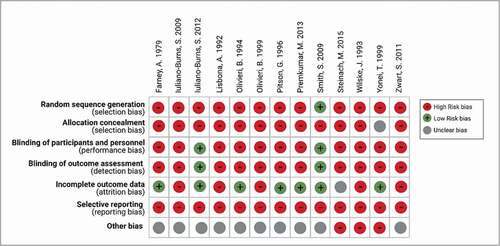
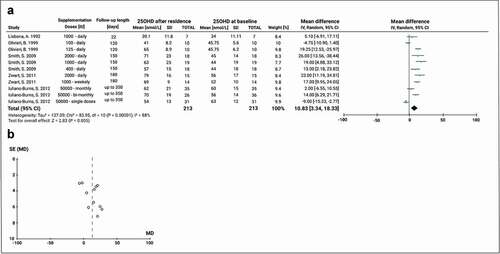
Figure 4. Meta-analysis of 25(OH)D serum change pre- and post- Antarctic residence in non-supplemented subjects. A) Mean difference forest plot of 25(OH)D. The mean differences were calculated based on 25(OH)D serum level at baseline and after a completed stay on the Antarctic or sub-Antarctic bases. The studies of Lisbona, A. 1992 and Iuliano-Burns, S. 2012 are included only with the non-interventional group. Values represent the mean effect sizes within a study. B) Funnel plot for publication bias. SE: Standard error of the mean difference
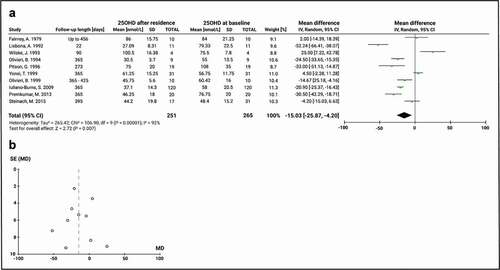
Figure 5. Comparison of 25(OH)D before and after a summer stay in Antarctica in subjects not receiving vitamin D supplementation. A) Mean difference forest plot of 25(OH)D. The mean differences were calculated based on 25(OH)D serum level at baseline and after at least 22 days of stay among December and February. Values represent the mean effect sizes within a study. B) Funnel plot for publication bias. SE: Standard error of the mean difference
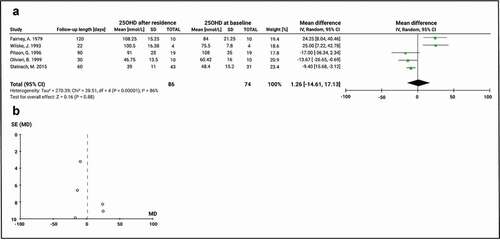
Figure 6. Comparison of 25(OH)D before and after overwintering in Antarctica in subjects not receiving vitamin D supplementation. A) Mean difference forest plot of 25(OH)D. The mean differences were calculated based on 25(OH)D serum level at baseline and after a residence between March and September. Values represent the mean effect sizes within a study. B) Funnel plot for publication bias. SE: Standard error of the mean difference
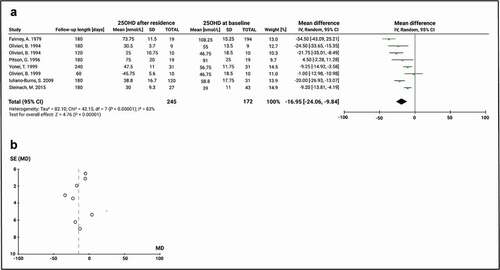
Figure 7. Meta-analysis of the effect of VD supplementation on serum 25(OH)D concentrations during Antarctic residence. A) Mean difference forest plot of the effect of VD supplementation. The mean differences were calculated based on 25(OH)D serum level at baseline and after Antarctic residence in the supplemented groups. Values represent the mean effect sizes within a study. B) Funnel plot for publication bias. SE: Standard error of the mean difference