
Figures & data
Figure 1. Flow chart for recruitment and follow-up of study participants from November 1993 to February 2016 including reasons and number of excluded participants through follow-ups. Note: NIH, National Institutes of Health; NCDS, Nunavik Child Development Study.
Figure 2. List of unintentional injury causes, Nunavik Child Development Study, Youth population, Nunavik, 2013–2015.
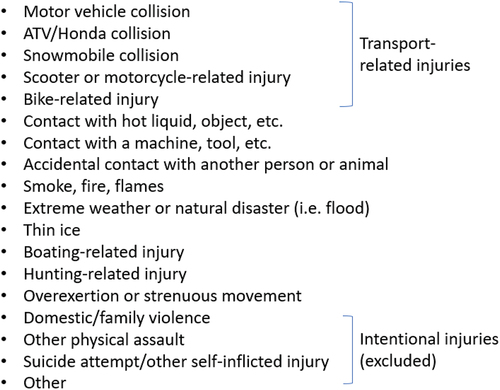
Table 1. Socio-demographic and substance use characteristics of youth participants, N (%) and mean (Standard deviation-SD), Nunavik Child Development Study, Nunavik, 2013–2015
Table 2. Multivariable logistic regression model results for the relationship between socio-demographic, substance use characteristics, and unintentional injury occurrence among youth participants, Nunavik Child Development Study, Nunavik, 2013–2015