
Figures & data
Table 1. Summary of the anthropometrics for the herders in the October 2018 and January 2019 data collection periods. The age and sex categories have been removed to protect participant confidentiality
Table 2. Summary of the cardiometabolic biomarker measures for the herders from the October 2018 and January 2019 data collections. The age and sex categories have been removed to protect participant confidentiality
Table 3. Prevalence of overweight, obesity, and cardiometabolic biomarkers outside of the recommended range for the pooled sample
Figure 1. These are the pooled values for glucose (N = 25), corrected total cholesterol (N = 25), corrected HDL-cholesterol (N = 25), LDL-cholesterol (N = 18), and triglycerides (N = 18). The red box and lines indicate the normal, healthy values for each measure. For HDL cholesterol, only the normal value for females is presented (>1.2 nnmol/L). The health value for males in Finland is >1.0 nnmol/L.
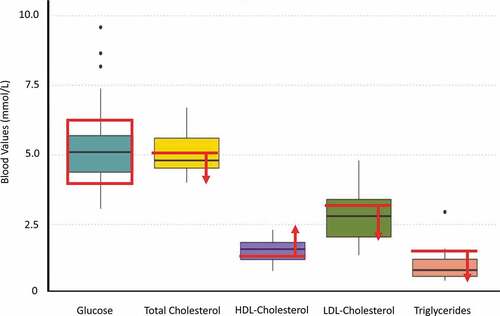
Figure 2. Females are indicated in purple circles and males in organe X’s. a & b: Regression of the pooled corrected total cholesterol levels (N = 25)against body mass index (A) and body fat percentage (B). Neither BMI nor body fat percentage were a significant predictor of corrected total cholesterol levels. c & d: Regression of the pooled glucose levels (N = 25) against body mass index (C) and body fat percentage (D). Neither BMI nor body fat percentage were a significant predictor of glucose levels. e & f: Regression of the pooled corrected HDL cholesterol levels (N = 25) against body mass index (E) and body fat percentage (F). Neither BMI nor body fat percentage were a significant predictor of corrected HDL cholesterol levels. g & h: Regression of LDL cholesterol levels (N = 18) against body mass index (G) and body fat percentage (H). Neither BMI nor body fat percentage were a significant predictor of LDL cholesterol levels, though sex was a significant predictor. i & j: Regression of the triglyceride levels (N = 18) against body mass index (I) and body fat percentage (J). Neither BMI nor body fat percentage were a significant predictor of triglyceride levels.
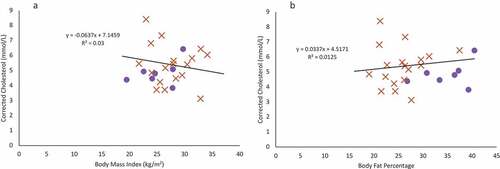
Figure 2. Continued.
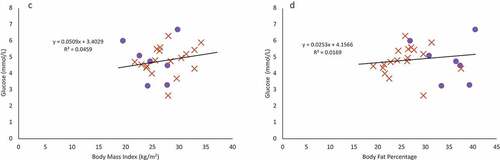
Figure 2. Continued.
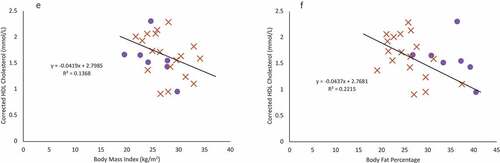
Figure 2. Continued.
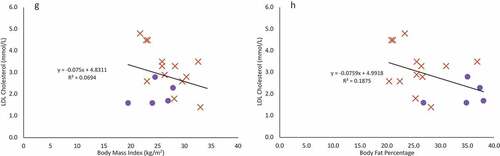
Figure 2. Continued.
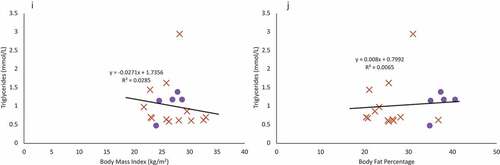
Table 4. Results of the multiple regression models for the relationship between BMI, body adiposity, and the cardiometabolic biomarkers of corrected total cholesterol, glucose, corrected HDL cholesterol, LDL cholesterol, and triglycerides
Data Availability Statement
The authors confirm that the data supporting the findings of this study are available within the article.