Figures & data
Figure 1. Schematic drawing of Mobil sanitising trailer (MST).
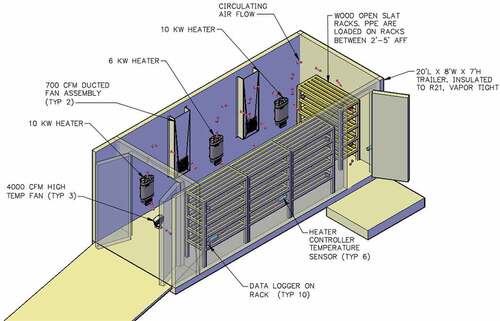
Figure 2. MST on site at Alaska native medical centre.
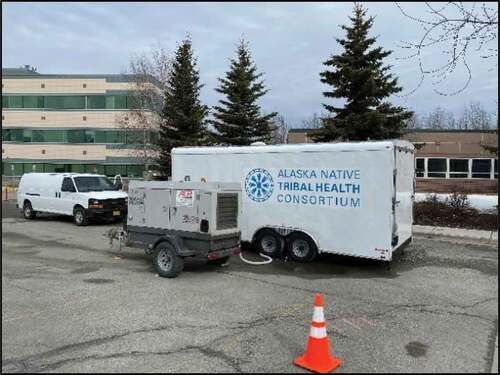
Figure 3. Fit test of N-95 respirator.
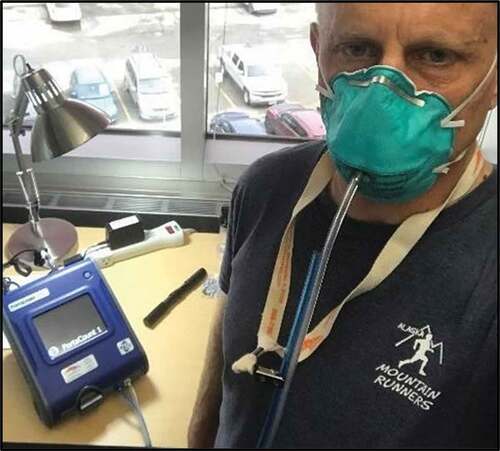
Figure 4. Three N-95 models used for fit test experiment.
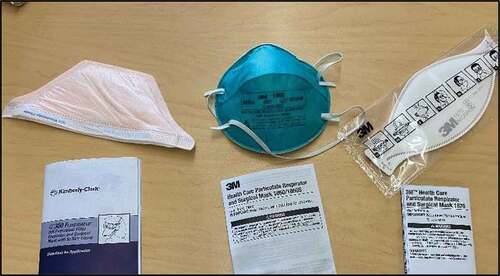
Figure 5. Sample plate setup with FFR components.
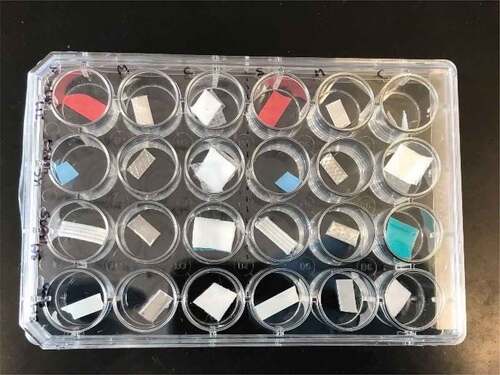
Figure 6. Preparing samples for heat treatment.
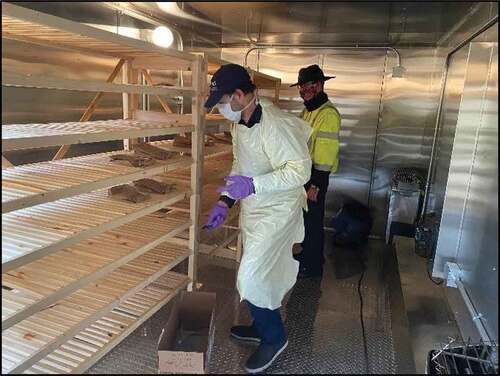
Figure 7. MST average temperature, data logger temperature and relative humidity for 60-minute cycle.
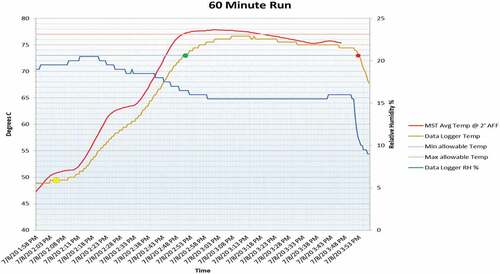
Figure 8. FFR cloth samples (M1-M4, x-axis) were inoculated with 5 × 10⁴ infectious units (I.U.) (see Methods) of influenza A/WSN/33 (H1N1) virus (WSN Titre, y-axis) and heat treated at 75°C for 0, 30, 60, or 90 minutes followed by 24 hr. at ambient room temperature, and recovered in PBS. Control samples were inoculated for the indicated times, and then left untreated for 24 hours at ambient room temperature. WSN titres were analysed by limiting dilution assay on A549 cells (I.U.). FFR types included 3 M 1870 (M1), KC 46827 (M2), 3 M 1860S (M3), and 3 M 8200 (M4). WSN virus was inactivated in all samples treated with heat for 30, 60 and 90 minutes.
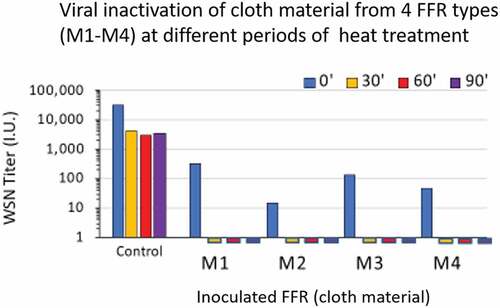
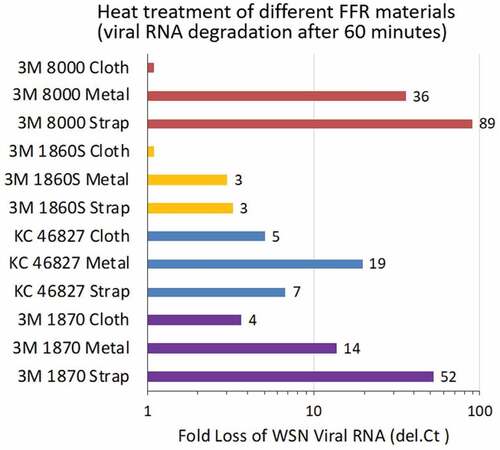
Figure 9. FFR materials (y-axis) were inoculated with 5 × 10⁴ infectious units (I.U.) of influenza A/WSN/33 (H1N1) virus, and left untreated for 24 hr., or heat treated at 75°C for 60 minutes followed by 24 hr. at ambient room temperature. RNA was recovered and residual WSN viral RNA was measured by quantitative Spackman M-probe RT-PCR in comparison to control (0’, untreated) for each FFR material; fold (log base 2del.Ct) difference in PCR cycle threshold value (number of cycles difference between 0’ untreated and treated for each material yields delta Ct, 2del.Ctn displayed on, x-axis), corresponding to 2 n loss of WSN viral RNA signal.