
Figures & data
Figure 1. Flow chart for the study population.
Figure 2. Timeline of the diagnostic process with specified intervals.
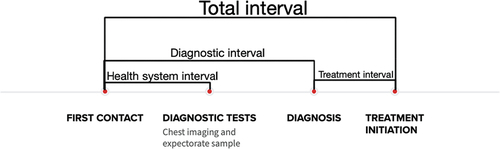
Table 1. The characteristics of the 153 included patients with active TB
Table 2. The diagnostic intervals for the 153 TB patients shown for all and divided into patients in towns and settlements
Figure 3. Boxplot depicting the total interval with median, quartiles, whiskers and outliers. Cases were considered as outliers if their data exceeded the 1st or 3rd quartile with 1.5 times the interquartile range.
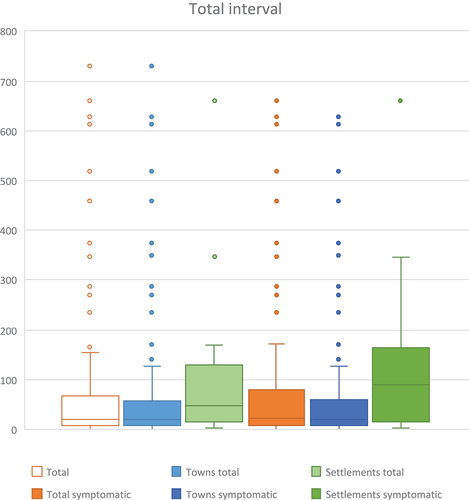
Table 3. The total intervals for the 153 TB patients shown for all and divided into patients in towns and settlements
Table 4. The treatment intervals for the 153 TB patients shown for all and divided into patients in towns and settlements
Table 5. Time intervals from contact to chest imaging for the 153 TB patients shown for all and divided into patients in towns and settlements
Table 6. Time intervals from contact to expectorate sample collection for the 153 TB patients shown for all and divided into patients in towns and settlements