513
Views
0
CrossRef citations to date
0
Altmetric
Original Research Article

Comparing the effectiveness of competition as a method of reminding primary oral health care dentists to record diagnoses with two alternative methods used to enhance the recording of diagnoses in primary health care

, ORCID Icon, ORCID Icon, ORCID Icon, & ORCID Icon
Article: 2125067 | Received 30 May 2022, Accepted 12 Sep 2022, Published online: 21 Sep 2022

Figures & data

Figure 1. The rates of change in the proportions of visits with recorded diagnoses the year before, during the first year of the announcement of competition in recording diagnoses (RRD intervention) and the year after that intervention. Different dashed lines are used to clarify the change of rate slopes during these different time periods.
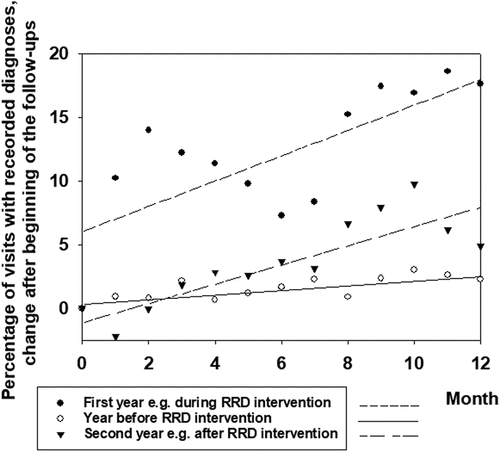
Figure 1. The rates of change in the proportions of visits with recorded diagnoses the year before, during the first year of the announcement of competition in recording diagnoses (RRD intervention) and the year after that intervention. Different dashed lines are used to clarify the change of rate slopes during these different time periods.

Figure 2. The rates of change in the recording of diagnoses during the first year after implementing the interventions. The three lines represent the mean rates in enhancement of recording of diagnoses due to different methods. In Figure 2a change in percentage of visits with recorded diagnosis. Different dashed lines are used to clarify the change of rate slopes of these three interventions. In Figure 2a change in absolute numbers of monthly visits with recorded diagnosis. In Figure 2c change in absolute numbers of monthly visits to clinicians.
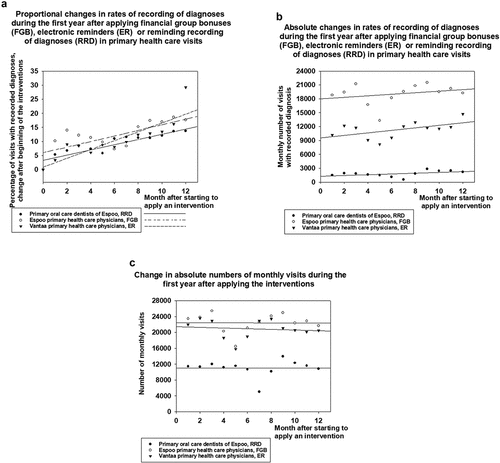
Figure 2. The rates of change in the recording of diagnoses during the first year after implementing the interventions. The three lines represent the mean rates in enhancement of recording of diagnoses due to different methods. In Figure 2a change in percentage of visits with recorded diagnosis. Different dashed lines are used to clarify the change of rate slopes of these three interventions. In Figure 2a change in absolute numbers of monthly visits with recorded diagnosis. In Figure 2c change in absolute numbers of monthly visits to clinicians.

Table 1. Yearly proportions of visits with recorded diagnoses before during and second year after starting the studied interventions. Absolute values of visits with recorded diagnoses and all visits are presented in parentheses.

Data availability statement

The data presented in this study are available on request from the corresponding author.