
Figures & data
Figure 1. Flow chart for the 96 soldiers with frostbite sequel eligible for the study.
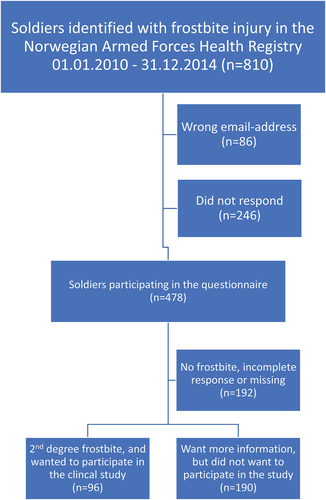
Figure 2. Primary and secondary treatment groups at different timepoints in the study.
Figure 3. Injection of BTX-A were given near the neurovascular bundle at the A1-A5 pulley at the basis of digit 1–5 in the palm of the hand.
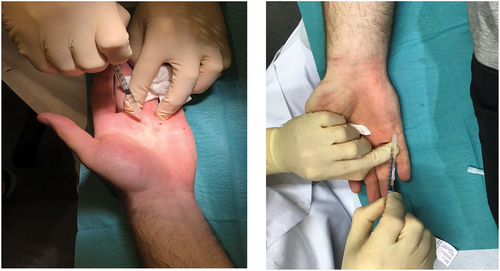
Table 1. Clinical data from the pilot study.
Figure 4. Thermographic images from patient 1 exemplify the rewarming of the dorsal side of the hands at 6 months follow-up encompassed a pre-cooling phase (T1), a cooling phase with hands immersed in water for one minute (T2), and a four-minute recovery phase (T3, T4, T5 and T6) demonstrated by Dynamic Infrared Thermography.
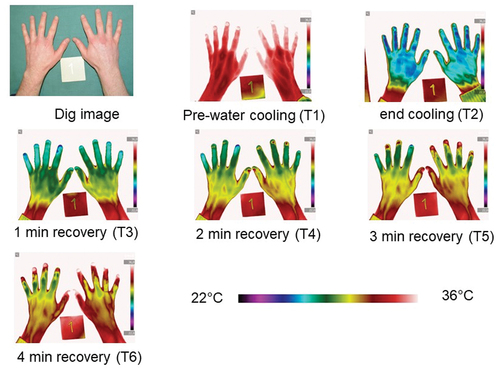
Figure 5. Mean hand skin temperature versus time demonstrated in patient 3 with Dynamic Infrared Thermography (DIRT) at four rounds (inclusion, 6 weeks, 12 weeks, 6 months) encompassed a pre-cooling phase (T1), a cooling phase with hands immersed in water for one minute (T2), and a four-minute recovery phase (T3, T4, T5 and T6).
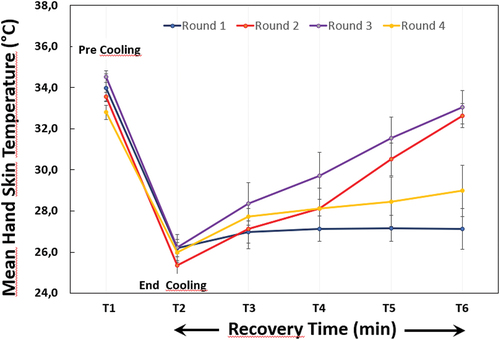
Figure 6. Quantitative sensory testing (QST) at the affected hand for all subjects over time. While the mechanical parameters are all within the confidence interval for age-corrected healthy subjects (dashed line − 95% confidence interval), there are impressive changes for the thermal detection thresholds, especially for the cold detection threshold (CDT). After therapy, these parameters returned in a direction towards normalization. WDT – warm detection threshold, TSL – thermal sensory limen, CPT – cold pain threshold, HPT – heat detection threshold, MDT – mechanical detection threshold, MPT – mechanical pain threshold, MPS – mechanical pain sensitivity, WUR – wind-up ratio, VDT – vibration detection threshold, PPT – pressure pain threshold; T1 – before intervention, T2–6 weeks, T3–12 weeks follow-up. QST-data were not obtained at 6 months follow-up.
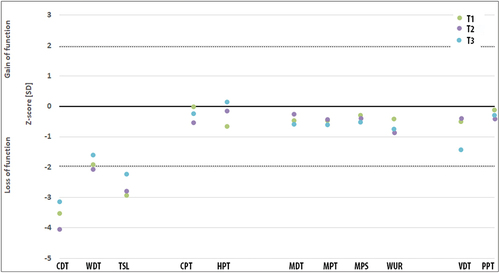
Table 2. Mean difference of change in mean PSSS between the groups, standard deviation of the difference and threshold (Δ/2) for indication of effect of the between group difference. Further research is not recommended since the difference in score is lower than Δ/2.